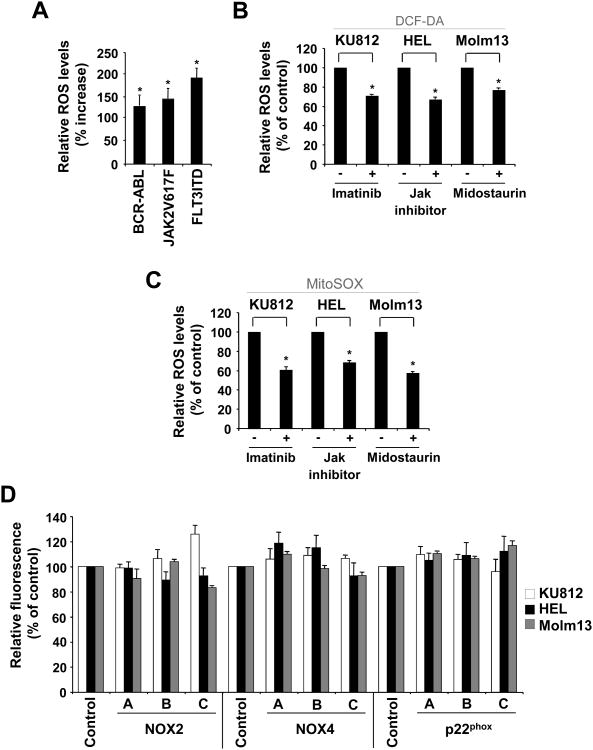
Figure 3. ROS in cells transformed by tyrosine kinase oncogenes.
Intracellular ROS levels were measured by DCF-DA (A, B, D) or MitoSox (C) staining in tyrosine kinase transformed cells or in response to targeted approaches. A. BaF3 cells expressing either BCR-ABL, JAK2V617F or FLT3ITD were compared to the parental cell line (left panel). B-D. KU812 (BCR-ABL), HEL (JAK2V617F) and Molm13 (FLT3ITD) cells were compared to kinase inhibitor treated cells (18h), as indicated (B-C) or control cells were compared to cells with NOX2, NOX4 and p22phox knockdown (D). (n=3, *p<0.05).

