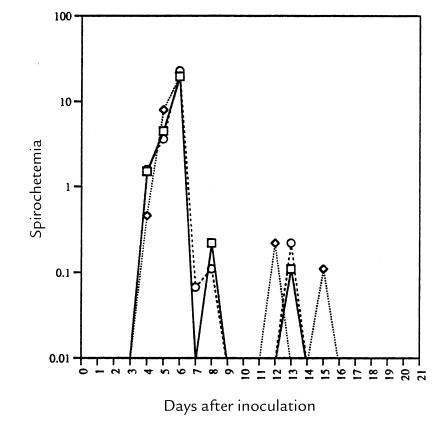
Figure 1.
The mean course of the spirochetemia in plg–/– (circles), control plg+/– (diamonds), and control plg+/+ (squares) mice (n = 10 mice of each genotype) in a logarithmic scale after subcutaneous inoculation of 104 organisms. Error bars for each point were omitted for clarity; the highest SD at peak was 1.4 × 10⁶ organisms.

