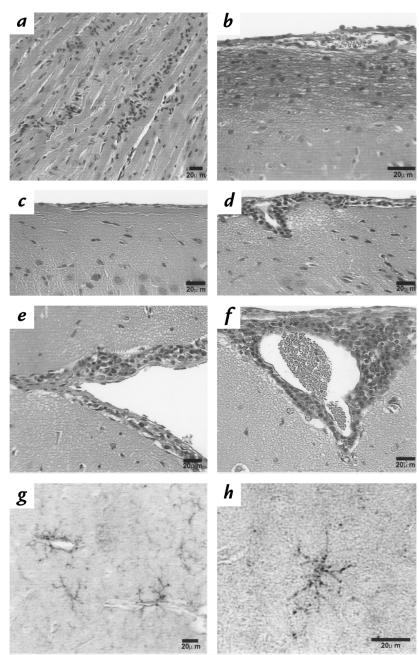
Figure 2.
Histopathology of organs. (a–f) Shown are 8-μm sections. All except b were stained with hematoxylin and eosin. (a) Heart of a mouse at peak spirochetemia with mononuclear cell infiltration of the myocardium. (b) Fibrin deposition in the submeningeal region of the brain of a plg–/– mouse after peak, stained with the Martius-scarlet-blue method. (c) Normal meninges of an uninfected control mouse. (d) Perivascular mononuclear cell infiltrate and submeningeal edema corresponding to the one-layer (+1) value of the inflammatory index at 28–30 days after inoculation in the brain of a plg–/– mouse. (e) Two layers of inflammatory cells in the meninges, corresponding to a +2 value in the inflammatory index, extending into the fissure at 28–30 days in a control mouse. (f) A +3 inflammatory index value with submeningeal edema in a control mouse. (g–h) Shown are 15-μm sections of brains from infected mice at 28–30 days. Each was stained with monoclonal antibody F4/80 to murine activated macrophage/microglia and developed with diaminobenzidine. (g) Cluster of perivascular F4/80 reactivity in the brain of a plg +/– control mouse. (h) Solitary microglia illustrating the morphology and large size of these cells.

