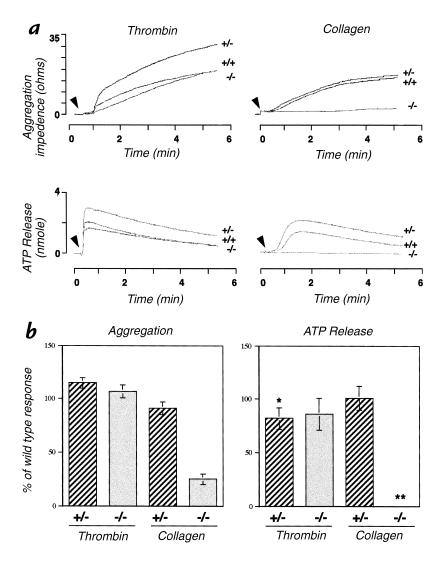
Figure 4.
Platelet aggregation and ATP release in response to thrombin or collagen. Whole blood was isolated from SLP-76 +/+, +/–, or –/– mice, and platelet number was normalized before analysis. (a) Aggregation and ATP release tracings from one representative experiment. Arrowheads indicate the point at which the indicated agonist was added. (b) Change in impedence (AGGREGATION) or ATP concentration (ATP RELEASE) was determined for each sample at the same time point after addition of thrombin or collagen by measuring the amplitude of the response. The timepoint at which the response was measured correlated with the maximal response. The values obtained for the +/– and –/– samples were normalized by calculating the percent of the +/+ response. The SEM for each group is shown. *These data were obtained from four independent experiments. In all other cases, data was obtained from five independent experiments. **In all experiments, ATP release from SLP-76–/– platelets after exposure to collagen was not detectable.

