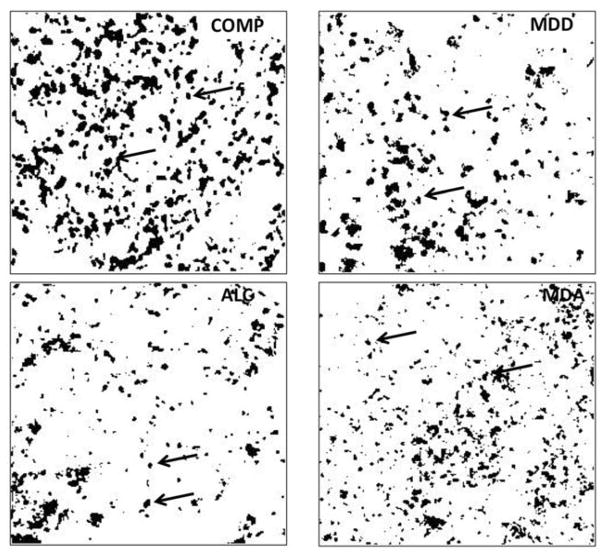
Figure 3.
Binary rendering of the four micrographs in Fig. 2 using Image J software and applying the same procedure to each micrograph to establish a threshold and differentiate Cx43 immunoreactive structures (black spots) from non-immunoreactive background (white background). Abbreviations, arrows and dimensions are as in figure 1.

