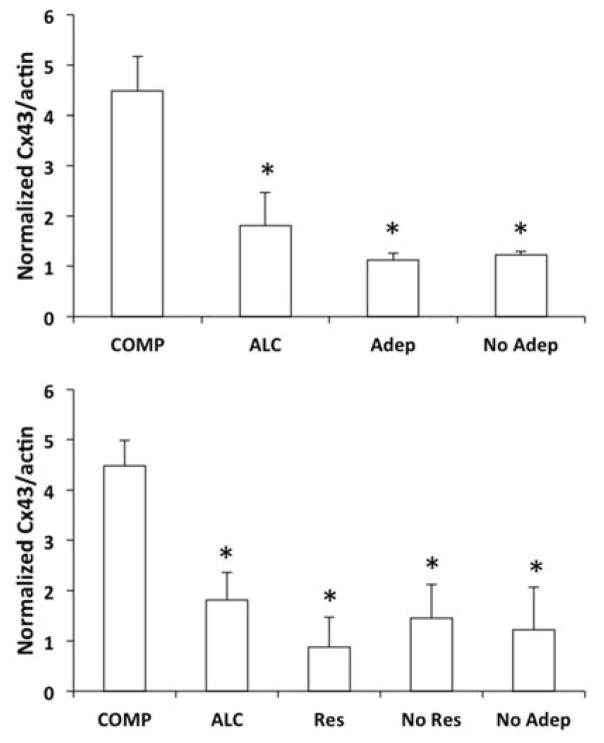
Figure 5.
Bar graphs representing differences in the Western blot-base levels of Cx43 in the OFC of non-psychiatric comparison (COMP), alcohol dependent (ALC, without depression), and subjects with major depression (Adep, NoAdep). In the top panel major depression subjects treated with a current prescription of antidepressant (Adep) were separated from those without antidepressants (NoAdep) (ANOVA F(3,68)=11.255, p<0.001). In the bottom panel Adep subjects were further subdivided into responders to the antidepressant treatment (Res) and non-responders (No Res) F(4,67)=8.49, p<0.001). Note a significantly lower level of Cx43 in all groups diagnosed with major depression or alcoholism regardless of antidepressant treatment (with *p<0.002 in the top panel and *p<0.003 in the bottom panel, against COMP subjects).

