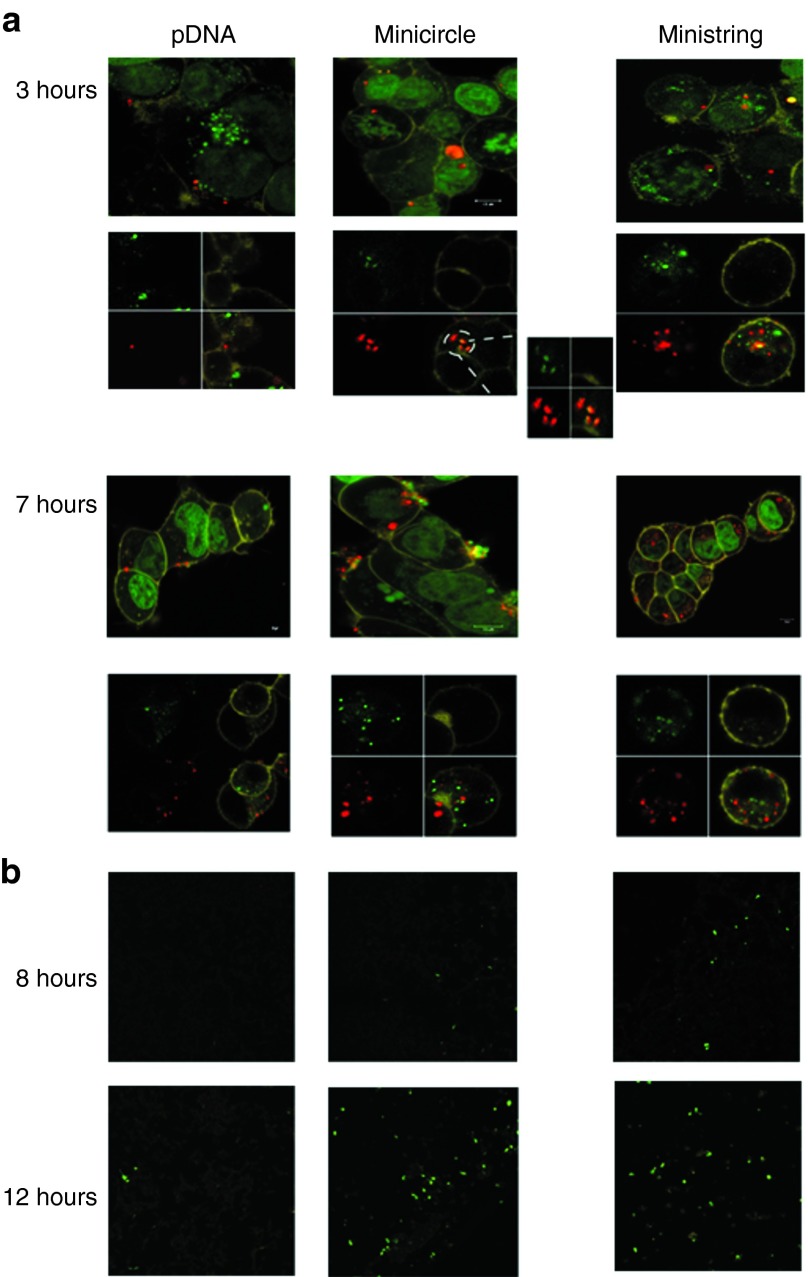
Figure 3.
Effect of pDNA size and topology on intracellular kinetics. Confocal microscopic analysis of the uptake and distribution (panel a) and eGFP expression (panel b) of minicircle and ministring DNA in HEK 293 cells. Cells were imaged at 3 and 7 hours after dosing with the three different Cy5-labelled vectors complexed with Lipofectamine at 37 °C under two separate staining conditions: the first row of panel a 3- and 7-hour sections shows cells stained with SYTO 21 green nuclear stain and CellMask Orange cell membrane stain and the second row shows cells stained with LysoTracker green and CellMask Orange. The four pictures in the second rows represent signals in the three separate channels for LysoTracker green, CellMask orange, Cy5 and all combined (clockwise). Panel b shows eGFP expression for the three different vectors at 8 and 12 hours after incubation after removing the transfection complexes (transfection time was 6 hours).

