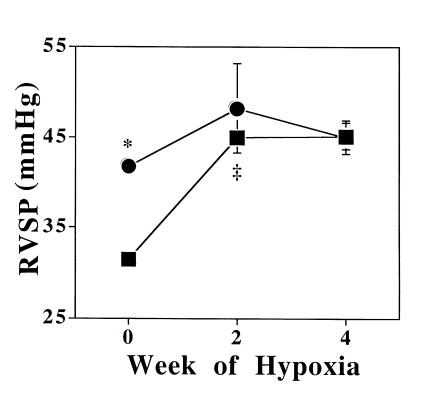
Figure 2.
Right ventricular systolic pressure (RVSP; mean ± SEM) in eNOS–/– (closed circles) and control (+/+) (closed squares) mice at baseline in mild hypoxia (n = 6 and 8, respectively), and after 2 and 4 weeks of severe, sustained hypoxia (n = 4 and 5; 7 and 8, respectively). At baseline, eNOS–/– mice had significantly increased right ventricular pressures (*P < 0.0001). eNOS–/– mice had a small increase in pulmonary pressure at 2 weeks of hypoxia that did not increase further. Pulmonary pressure in control mice increased to the same levels as eNOS–/– mice by 2 weeks of hypoxia (‡P < 0.001) and did not increase further after 2 additional weeks.

