Figure 2.
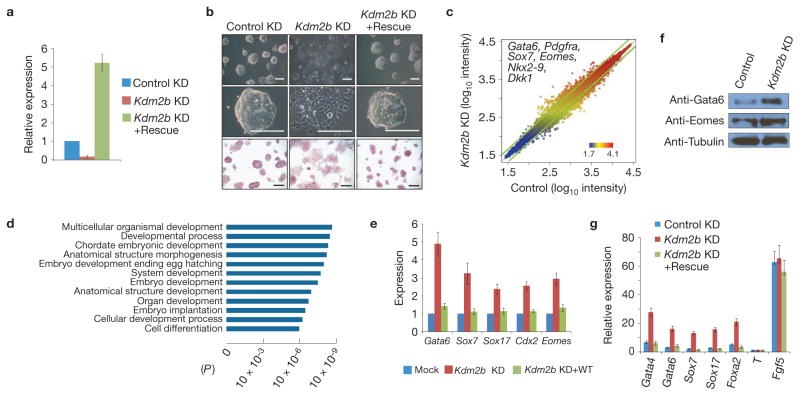
Depletion of Kdm2b induces mESC differentiation and causes aberrant gene expression. (a) Relative mRNA levels of Kdm2b in control, knockdown and rescued mESCs measured by RT–qPCR. The relative expression levels are normalized to Gapdh. The level of Kdm2b in the control knockdown mESCs is set as 1. Values represent means ± s.d. from three biological replicates. (b) Representative images show that the morphological changes of Kdm2b knockdown can be rescued by expression of exogenous Kdm2b (upper and middle panels). Bottom panels are images of alkaline phosphatase activity of the various mESCs. Scale bars, 100 μm. (c) Scatter plot shows the upregulated and downregulated genes in response to Kdm2b knockdown in mESCs. The top and bottom boundaries represent a ±1.5-fold change in gene expression. Representative early lineage genes upregulated by Kdm2b knockdown are listed. (d) Gene Ontology analysis of upregulated genes in response to Kdm2b knockdown. (e) Relative expression levels of representative primitive endoderm and trophoectoderm specific genes in control, Kdm2b knockdown and wild-type Kdm2b rescued mESCs. The mRNA levels were measured by RT–qPCR analyses. The mRNA level of Kdm2b in the control mESCs is arbitrarily set as 1. Data are mean ± s.d., n = 3. The source data for statistics are provided in Supplementary Table S5. (f) Western blot analyses show that Kdm2b knockdown causes an increase in Gata6 and Eomes protein levels. Tubulin serves as a loading control. Full scans of blots are shown in Supplementary Fig. S8b. (g) RT–qPCR analyses show the relative expression levels of lineage-specific genes in the control, Kdm2b knockdown and Kdm2b rescued mESCs at day 4 of embryoid body differentiation. The expression levels are normalized to Gapdh. The mRNA level of undifferentiated mESCs is set as 1. Data are mean ± s.d., n = 3. The source data for statistics are provided in Supplementary Table S5.

