Figure 4.
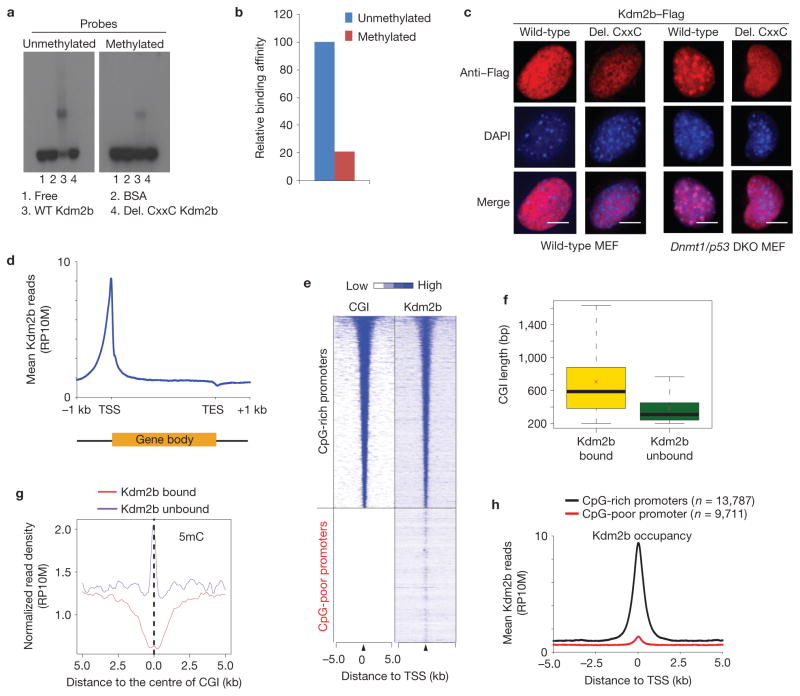
Kdm2b binds to unmethylated CGIs in vitro and in vivo. (a) EMSAs show that Kdm2b preferentially binds to unmethylated CpG-rich probes compared with the methylated probes. The binding activity depends on the CxxC-ZF domain (compare lanes 3 and 4). (b) Quantification of the relative Kdm2b-binding activity. The relative DNA binding activity is calculated as: intensity of shifted upper band/(intensity of upper band + intensity of lower band) ×100. The signal of binding with the unmethylated probe is set as 100. (c) Representative images showing the localization of wild-type and CxxC-ZF deletion mutant Kdm2b in wild-type and Dnmt1/p53 DKO murine embryonic fibroblasts. Note that wild-type Kdm2b, but not the CxxC-ZF deletion mutant, is localized to DAPI-heavy foci in the Dnmt1/p53 MEFs. Scale bars, 5 μm. (d) Global Kdm2b occupancy profile shows Kdm2b is enriched at TSSs but is depleted at TESs. Average Kdm2b signal for all annotated genes is shown along the transcription units from 1 kilobase (kb) upstream of TSS to 1 kb downstream of TES. RP10M, reads per 10 million reads. (e) Heat map representation of CGIs and Kdm2b occupancy at all annotated gene promoters (5 kb flanking TSSs of Refseq genes) in mESCs. The heat map is rank-ordered from genes with longest CGIs to no CGI within 5 kb genomic regions flanking TSSs. (f) The relationship between the lengths of CGIs and Kdm2b-binding states. The whiskers in the boxplot extend up to 1.5 times the interquartile range and data points beyond this range have been omitted for clarity of presentation. The x symbols show the group means. (g) The average 5-methylcytosine (5mC) signals of Kdm2b-bound and Kdm2b-unbound CGIs (ref. 45). (h) Kdm2b-binding profiles centred to TSS for CpG-rich promoters and CpG-poor promoters. The average Kdm2b signal for all annotated genes of the two groups within 5 kb genomic regions flanking TSSs is shown.

