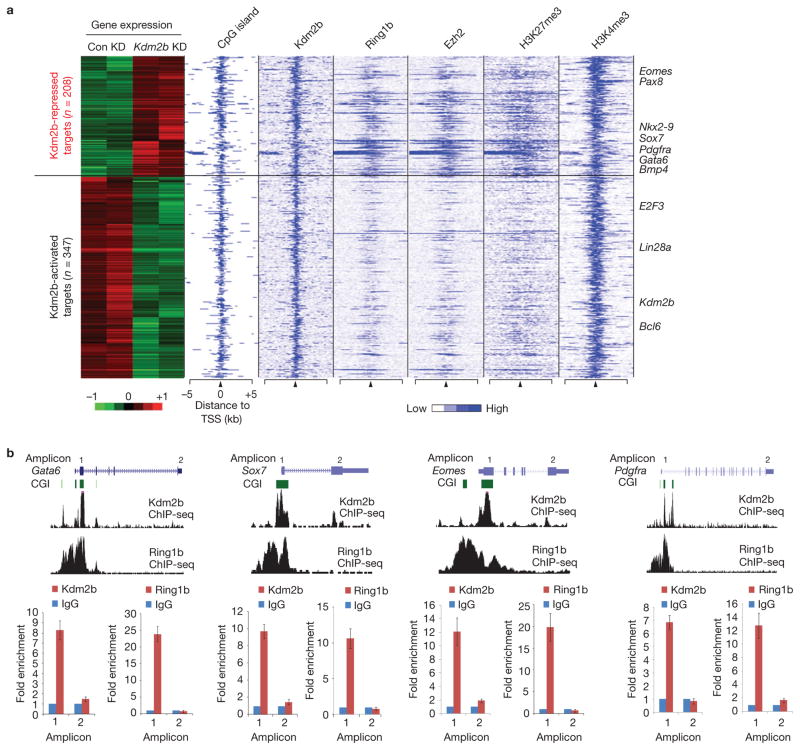
Figure 6.
Kdm2b and Ring1b co-occupy and repress early differentiation genes. (a) Heat map representation of differentially expressed Kdm2b targets in control and Kdm2b knockdown mESCs. The associated CGIs, the binding profiles of Kdm2b, Ring1b and Ezh2, and the distribution of H3K27me3 and H3K4me3 (ref. 54) within 5 kb genomic regions flanking the TSS of each gene are also shown. Representative differentially expressed genes are listed on the right of the panel. (b) Top, ChIP-seq results of Kdm2b and Ring1b at four representative genes Gata6, Sox7, Eomes and Pdgfra. Schematic illustration of the genomic structure of the gene locus, the associated CGIs and the location of amplicons analysed by ChIP–qPCR are also shown. Bottom, the relative enrichment of Kdm2b and Ring1b occupancy at the location of the amplicons indicated. The enrichment of occupancy was measured by ChIP–qPCR. The enrichment from the IgG control is set as 1. Data are mean ± s.d., n = 3. The source data for statistics are provided in Supplementary Table S5.

