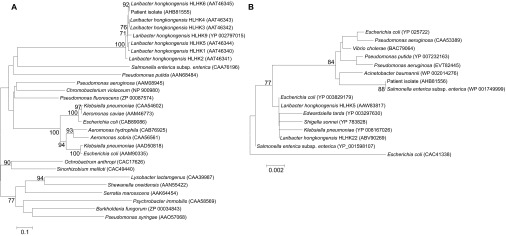
Figure 2.

Phylogenetic tree showing the relationships of the amino acid sequences of the (A) AmpC and (B) TetA proteins from the patient isolate with other related species. The tree was constructed using the neighbor-joining method with Jukes–Cantor correction. The bootstrap values calculated from 1000 trees are shown when they are ≥70%. The scale bars indicate the estimated number of substitutions per 10 and 500 amino acids. Names and accession numbers are presented as cited in the GenBank database.
