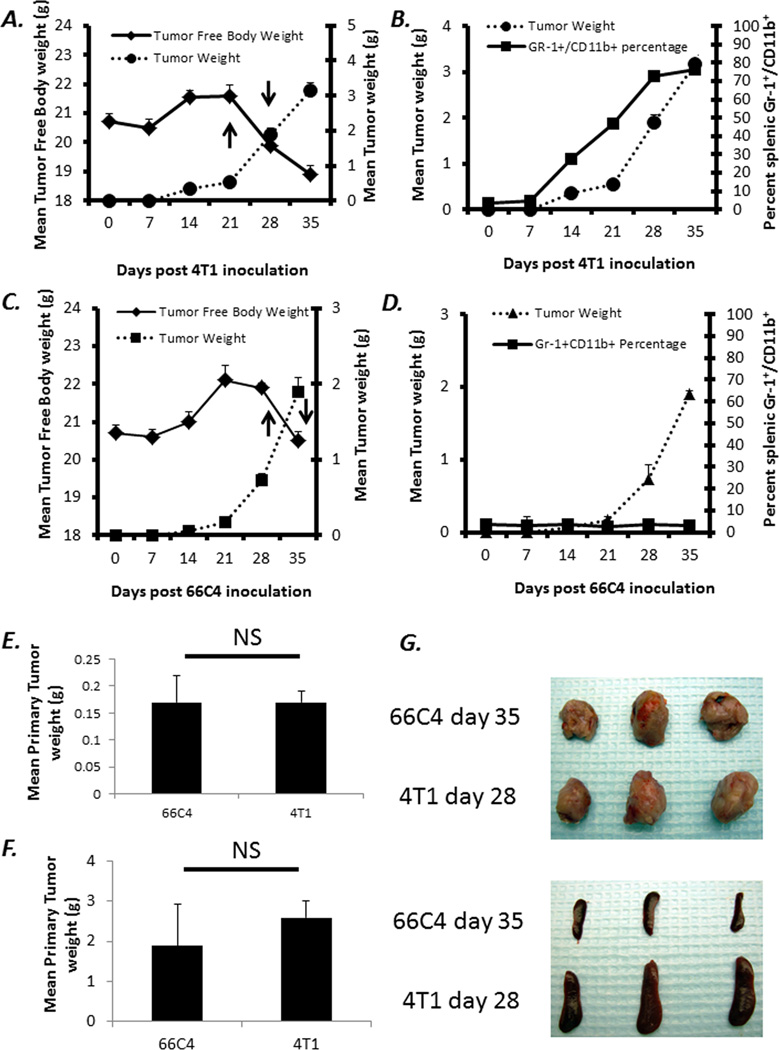
Figure 1. In vivo growth kinetics of 4T1 and 66C4 mammary carcinoma.
4T1 and 66C4 tumor cells were inoculated into Balb/c mice and followed for 35 days. (A and C) Body and Tumor weight measurements were taken at seven day intervals up to day 35. (B and D) Spleens were harvested from animals and assayed via flow cytometry for MDSCs also at seven day intervals (Gr-1+,CD11b+). Values represent percentage of live cells ± SD (n=5). (E) Comparison of primary tumor burden at day 35 post 66C4 inoculation and day 28 post 4T1 inoculation (NS: Not Significant) (F) Comparison of primary tumor burden at day 35 post 66C4 inoculation and day 28 post 4T1 inoculation (NS=Not Significant) (G) Primary tumors and lungs from 4T1 (28 days post inoculation) and 66C4 (35 days post inoculation).

