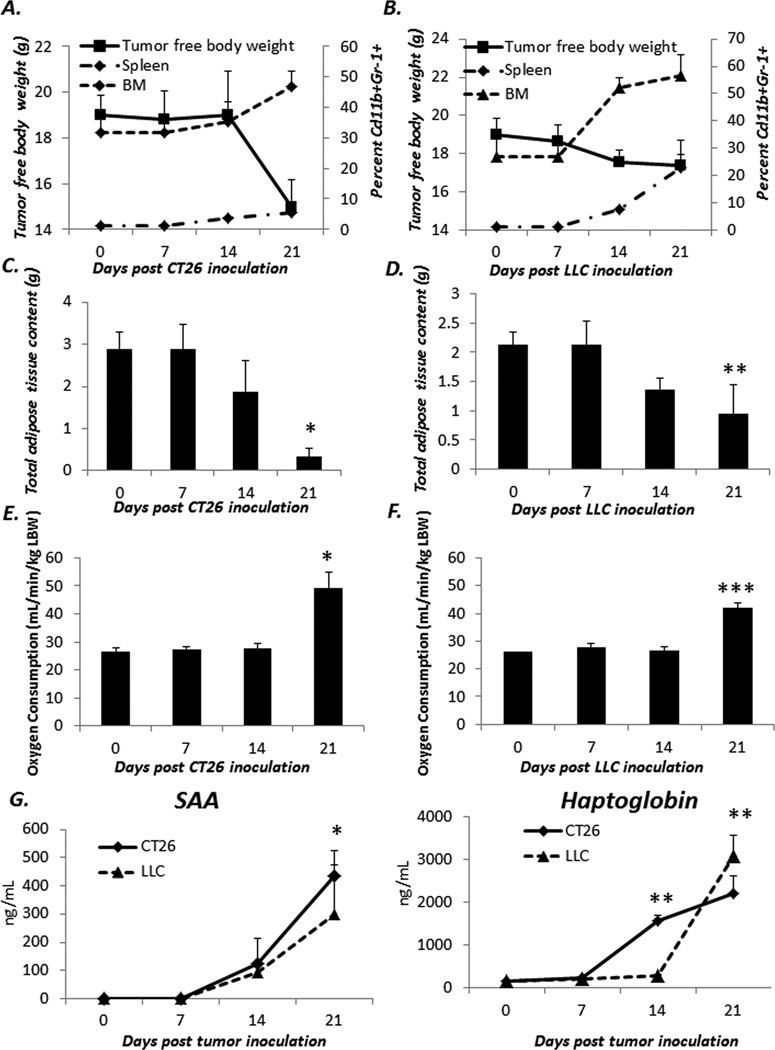
Figure 4. Changes in adiposity, oxygen consumption, and acute phase reactants also occur in other tumor models of cachexia following expansion of Gr-1+CD11b+ cells in the spleen and bone marrow.
CT26 and LLC was inoculated into naïve mice and followed for 21 days. Spleen and bone marrow (A and B) were harvested from tumor bearing animals at 7 day intervals and plotted against tumor free body weight (n=5/group). Total host adipose tissue content (C and D) and oxygen consumption (E and F) were measured at 7 day intervals as well. Values represent mean ± SD (n=5/group; * One way ANOVA on ranks p<0.001; ** Kruskall-Wallis One way ANOVA on ranks p=0.002; *** ANOVA on ranks p=0.009). Finally, serum from tumor bearing host was assayed via ELISA for the presence of serum amyloid A (SAA) and Haptoglobin (G) Values represent mean concentration in ng/mL and are ± SD (n=5/group; * One way ANOVA on ranks p<0.05; **Kruskall-Wallis One way ANOVA on ranks p<0.001).

