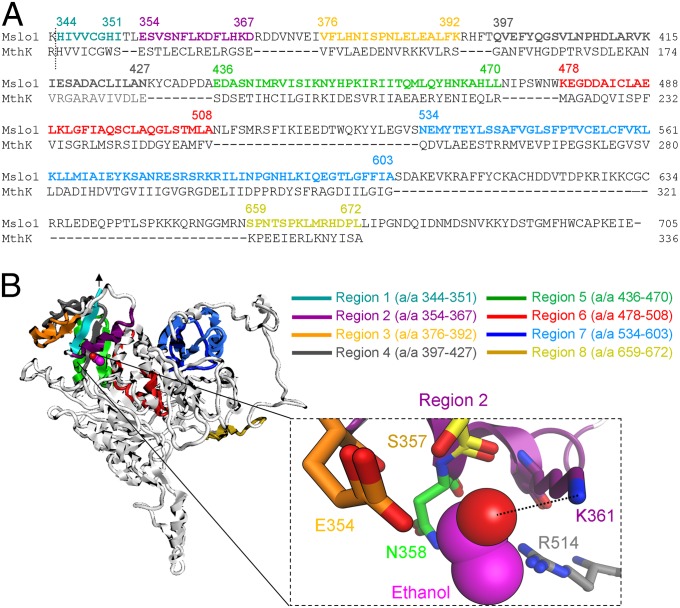
Fig. 1.
Ethanol-sensing site in mslo1 CTD. (A) Sequence alignment of ethanol-sensitive mslo1 and MthK proteins reveals eight common regions that may provide ethanol-sensitivity. A dotted line indicates the N-end of the slo1 CTD based on crystallography (33). Amino acid numbering follows the numbering of corresponding hslo1 residues (33). (B) Putative ethanol-sensing regions mapped on the mslo1 CTD homology model (side view). The ethanol C chain is shown in pink; oxygen is in red. An arrow points at the N-end of the CTD in contact with the membrane. (Inset) The ethanol-sensing region 2 (a/a 354–367) where K361 hydrogen bonds (dotted line) with ethanol. Nitrogen is blue; hydrogen is hidden to improve display.

