Fig. 1.
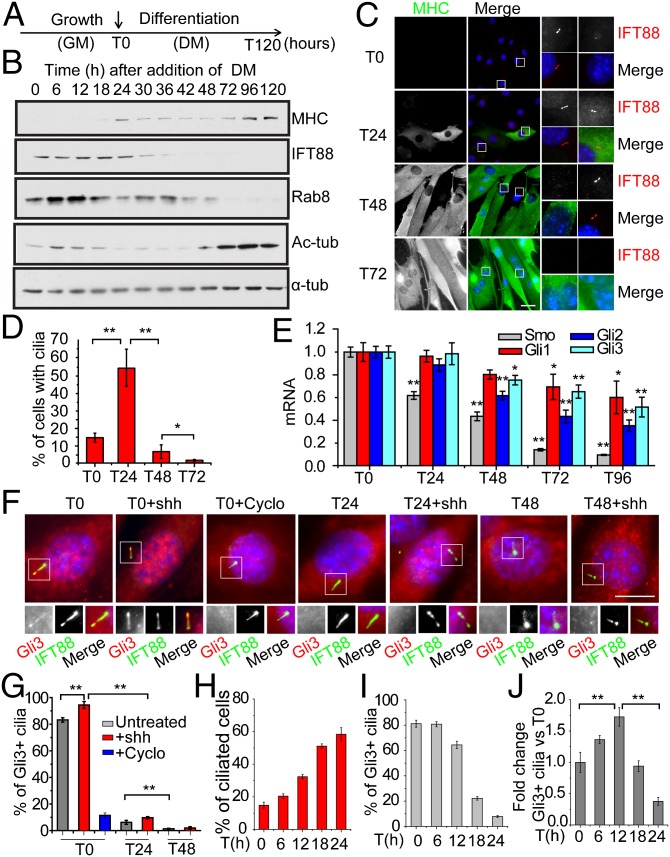
Primary cilia and Hh components are dynamically regulated during muscle differentiation. (A) Experimental setup for differentiation of primary mouse myoblasts. At T0, growth medium (GM) was replaced with differentiation medium (DM) to induce differentiation. (B) Western blotting of indicated proteins at different time points during the differentiation of primary mouse myoblasts. α-tub, α-tubulin; Ac-tub, acetylated-tubulin. (C) Representative immunofluorescence images of primary mouse myoblasts induced to differentiate and stained with indicated antibodies or DAPI (DNA) at different time points. Magnified views of the boxed Insets are shown on the right. (Scale bar, 30 μm.) (D) Quantification of the percentages of cilia as shown in C. Data are presented as mean ± SD. (E) qRT-PCR analysis of mRNA levels of Smo, Gli1, Gli2, and Gli3. Error bars, SEM. Student’s t test was performed by comparing expression at T0 with indicated times points. (F) Staining of Hh components during differentiation. Representative images are shown. Shh and cyclopamine (Cyclo) were used as indicated. Proteins and DNA were visualized as indicated, and magnified images are shown on the right. (Scale bar, 10 μm.) (G) Quantitative analysis of data in F, showing percentages of ciliated cells positive for Gli3 staining. Gli3 was considered positive when a clear axonemal staining was observed. Data are presented as mean ± SD. (H and I) Quantitative analysis of the percentage of cilia and Gli3-positive cilia. (J) Total number of ciliated cells positive for Gli3 staining was calculated. The data were divided by total number of cells and normalized against T0. In all cases, * and ** indicate P < 0.05 and P < 0.01, respectively, by Student t test.

