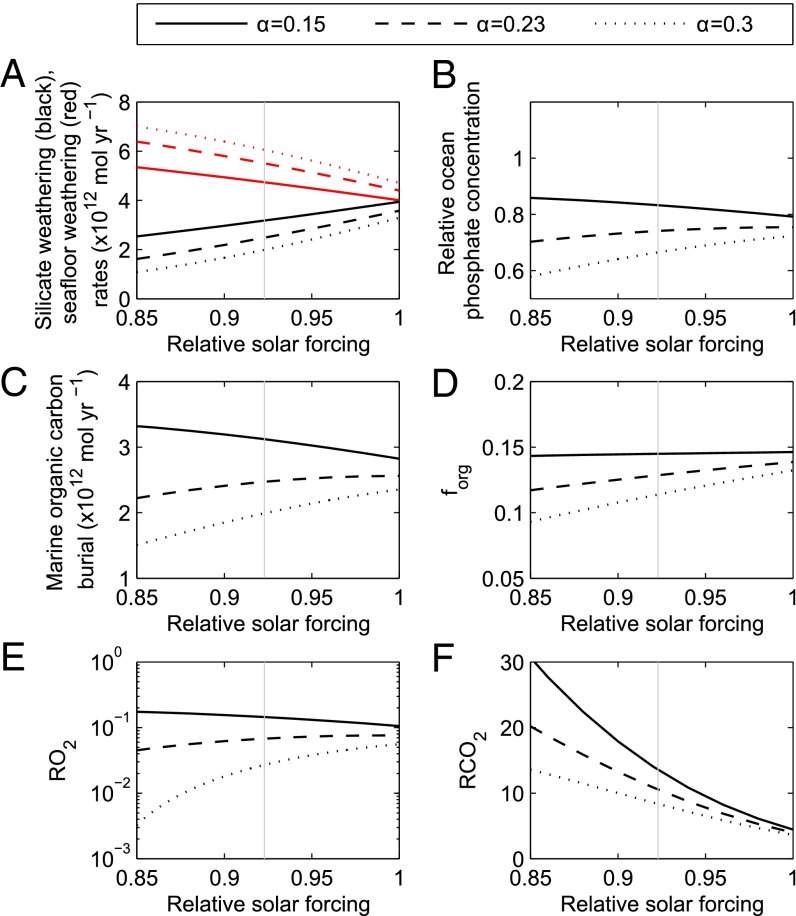
Fig. 4.
Model steady states at 1,000 Ma as a function of relative solar flux. Line type shows choices for the dependency of seafloor weathering rate on atmospheric CO2 concentration. Rates of silicate and seafloor weathering (A), relative ocean phosphate concentration (B), organic carbon burial rate (C), the fraction of carbon buried organically (D), relative atmospheric oxygen (E), and CO2 concentrations (F). Gray vertical line denotes assumed solar flux at 1,000 Ma (38). We assume a relative terrestrial weatherability and spreading rate of 1/4 (12) and 1.83 (37), respectively.

