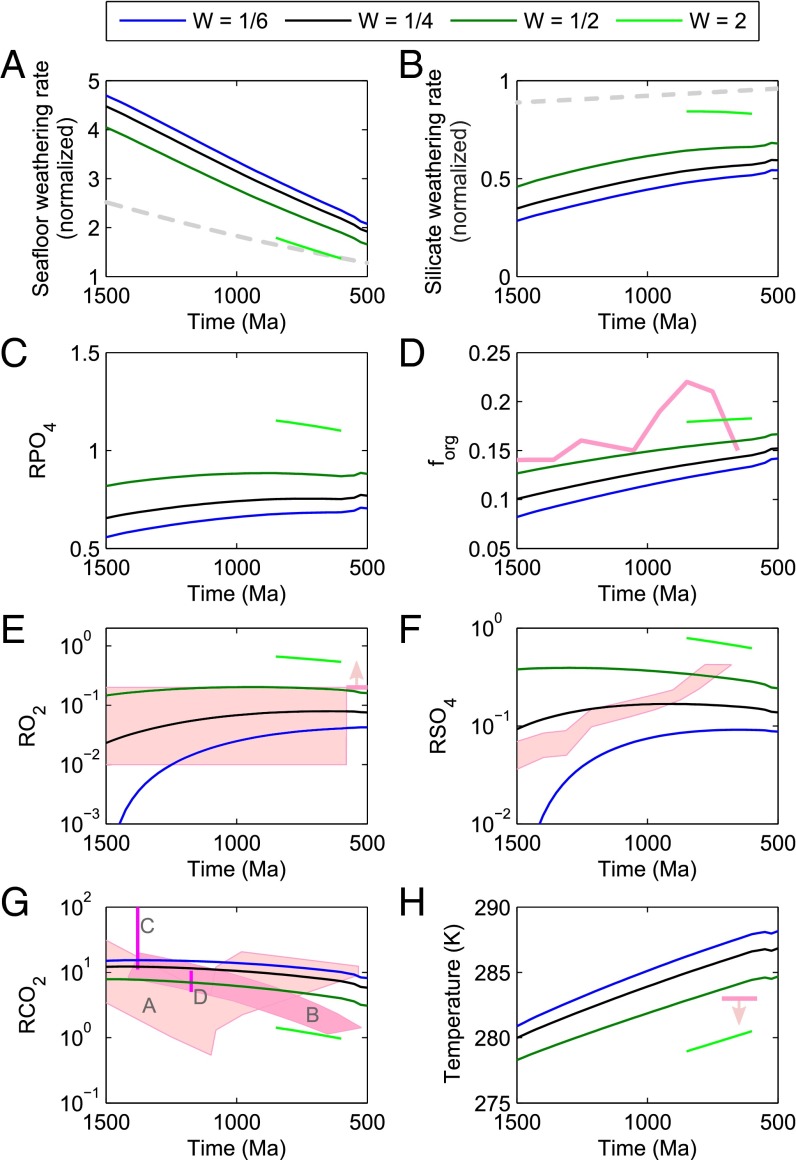
Fig. 5.
Model steady states at discrete time points for 1,500–500 Ma for α = 0.23. Line color denotes relative weatherability of the continents, W. Relative spreading rate (37) shown as dashed gray line in A; relative solar forcing (38) shown as dashed gray line in B. Geological constraints are shown in pink. Plotted are normalized rates of seafloor (A) and silicate (B) weathering; relative ocean phosphate concentration (C); the fraction of carbon buried organically (D); relative atmospheric oxygen concentration (E) against the constraints from refs. 6 and 39; relative ocean sulfate concentration (F) against ref. 3; relative CO2 concentration (G) against data from ref. 9 (A), ref. 40, (B), ref. 41 (C), and ref. 42 (D); and global average surface temperature (H) shown with expected low temperature during the Neoproterozoic glacial period (43).

