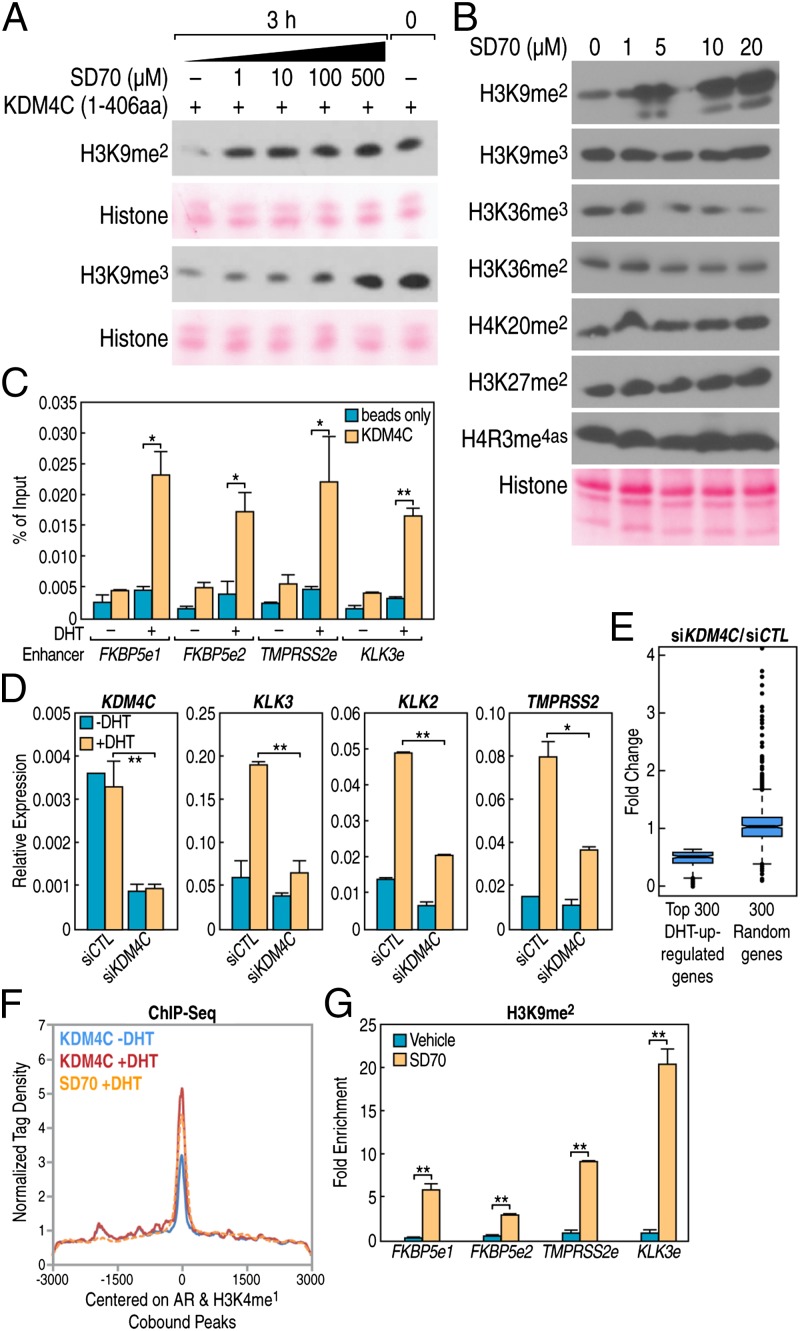
Fig. 4.
SD70 suppresses gene transcription through H3K9me2 regulation. (A) In vitro KDM4C demethylation assay showing the SD70 inhibition effect on H3K9me2 and H3K9me3 demethylation using histone from calf thymus as a substrate. (B) Western blot measurement of various histone marks in cells treated with different concentrations of SD70 for 24 h in 293T cells. Ponceau S staining for histone was shown as a loading control. (C) KDM4C ChIP-qPCR on indicated AR target gene enhancer loci. “e” represents the enhancer and the qPCR error bars indicate the SD of two repeats (*P < 0.05 and **P < 0.01). (D) RT-qPCR analyses of representative AR targets in LNCaP cells transfected with KDM4C or negative control siRNA. KDM4C itself showed knockdown efficiency. Error bars indicate SD of three repeats for KDM4C and two repeats for AR target genes. Cells were stripped for 3 d before being subjected to DHT (100 nM) stimulation for 8 h (*P < 0.05 and **P < 0.01). (E) siKDM4C knockdown suppresses the top 300 DHT-inducted gene expressions revealed by RNA-seq, but no effect on randomly chosen non–DHT-regulated genes. The RNA-seq procedure is described in SI Methods. (F) Average tag density profile centered on AR and H3K4me1 cooccupancy peaks showing the focal tag density of SD70 on AR enhancers with increased binding of KDM4C after DHT (100 nM) treatment for 1 h, as revealed by KDM4C ChIP-seq. (G) ChIP-qPCR indicates increased H3K9me2 mark on AR canonical targets enhancer and promoter. Error bars indicate the SD of three repeats (*P < 0.05 and **P < 0.01).

