
Fig. 5.
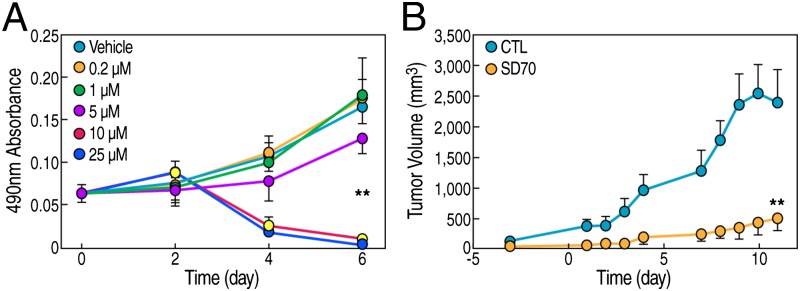
SD70 inhibits prostate cancer cell growth in vitro and tumor growth in vivo. (A) Growth curve of CWR22Rv1 cells with SD70 treatment concentrations indicated. Error bars indicate the SD of six repeats. (B) Growth curve of a CWR22Rv1 cell xenograft mouse model. The drug was given as 10 mg/kg i.p. injection once a day. Vehicle treatment served as the control. Time 0 indicates the first time point for treatment (n = 6 for the control group and n = 8 for the drug treatment group; **P < 0.01). Error bars stand for SD.