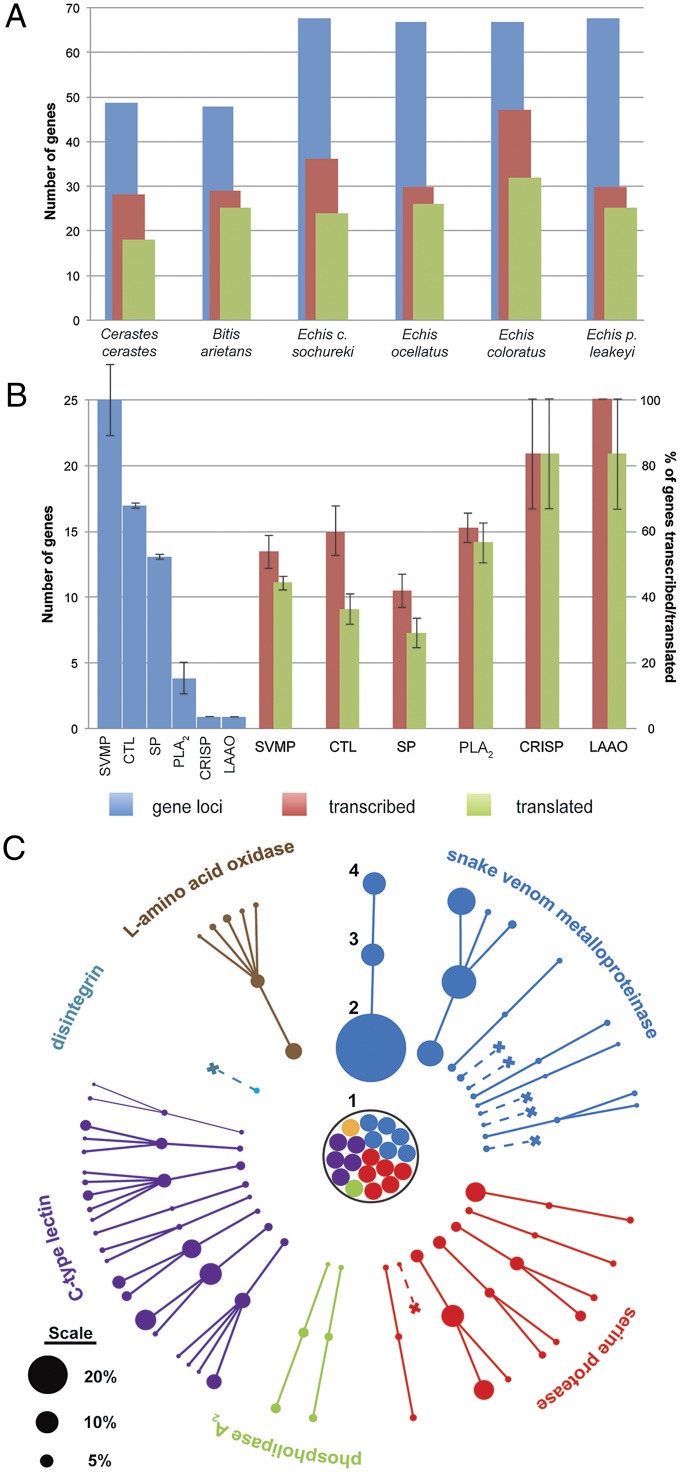
Fig. 3.
Variation in gene loci, gene transcription, and gene translation in the snake venom system. (A) Comparisons between species. Data are displayed as the total number of gene loci, genes transcribed, and genes translated for all venom toxin families in each species. (B) Comparisons between toxin families. Data are displayed as the mean number of gene loci per species (Left) and the mean percentage of those genes transcribed and translated summarized for all species (Right). Error bars represent SEM. Also see SI Appendix, Fig. S15. (C) Variation in the composition of toxins found in the venom system of B. arietans. (1) Predicted toxin genes that are untranscribed. (2) Venom gland transcribed toxin genes. (3) Corresponding toxins detected in the venom proteome. (4) Proteolysed protein products derived from each protein. Toxins are represented by nodes and their percentage abundance by node size (scale does not apply to part 1). Crosses indicate transcribed genes not translated. The orange node represents a predicted CRISP gene that was untranscribed.

