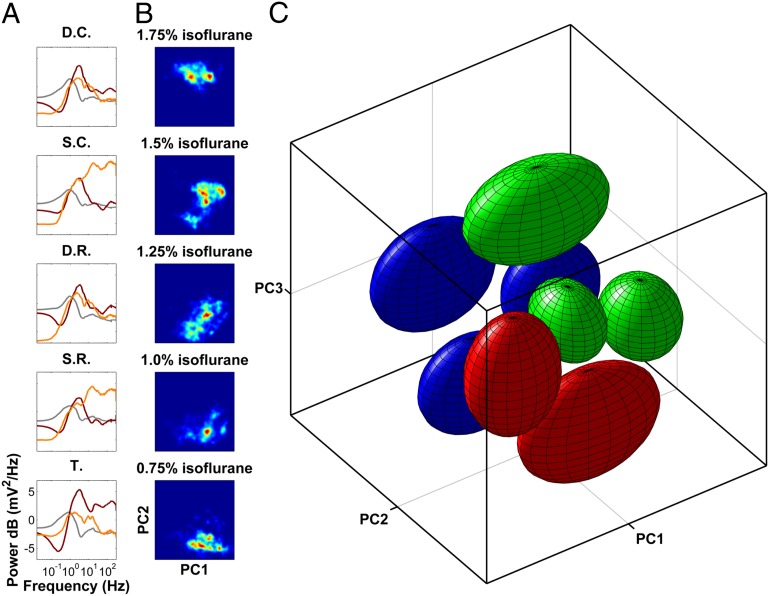
Fig. 3.
ROC is characterized by individually stabilized, discrete activity patterns. (A) PC1, -2, and -3 (gray, burgundy, and orange) plotted as a function of frequency and projected onto the corresponding anatomical sites. PCs reveal laminar cortical architecture whereby superficial and deep cortical layers form two distinct groups. High-frequency oscillations are captured by PC2 in the thalamus and PC3 in the superficial cortical layers. Thus, activation of neuronal activity in the thalamus is separable from that in the cortex. D.C., deep cingulate; D.R., deep retrosplenial; S.C., superficial cingulate; S.R., superficial retrosplenial; T. thalamus. (B) Probability density of data from all animals projected onto the plane spanned by PC1 and PC2 (red shows increased probability) shows multiple distinct peaks that change in prevalence and location, depending on anesthetic concentration. (C) In the space spanned by the first three PCs, data form eight distinct clusters (SI Materials and Methods). The approximate location of each cluster is shown by an ellipsoid centered at the cluster centroid. The radius of the ellipsoid along each dimension is the 90th percentile of the distance of all points in the cluster to the centroid along that dimension. Ellipsoids are colored according to the dominant spectral feature (Fig. 4; also see Movie S1 for better 3D visualization). These ellipsoids are analogous to 3D error bars that help visualize the approximate location of the clusters in the PCA space.

