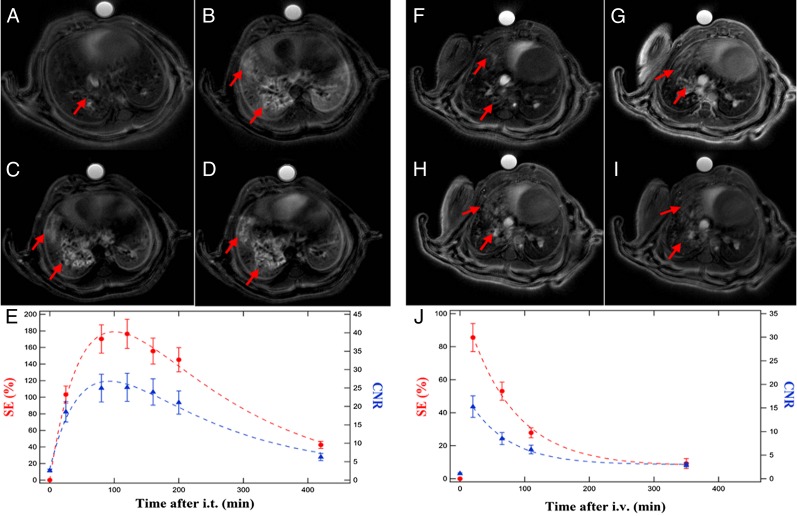
Fig. 3.
Representative examples of UTE MRI axial slices showing USRP accumulation in the tumor in the function of time after (A–E) i.t. (50 μL of 50 mmol/L [Gd3+], day 35) or (F–J) i.v. administration (200 μL of 50 mmol/L [Gd3+], day 38). The curves of signal enhancement (red, left scale) and CNR (blue, right scale) in E and J show the sensibly different pharmacokinetics observed after the i.v. or i.t. route. Dashed lines are used to indicate the curves trend. A was acquired before the i.t. administration of USRPs; B is after 30 min, C after 100 min, and D after 180 min. F was acquired before the i.v. administration of USRPs; G is after 15 min, H after 60 min, and I after 110 min. The arrows indicate the presence of the tumor and the accumulation of USRPs in the neoplastic lesions. Data in E and J are presented as mean value ± SEM.

