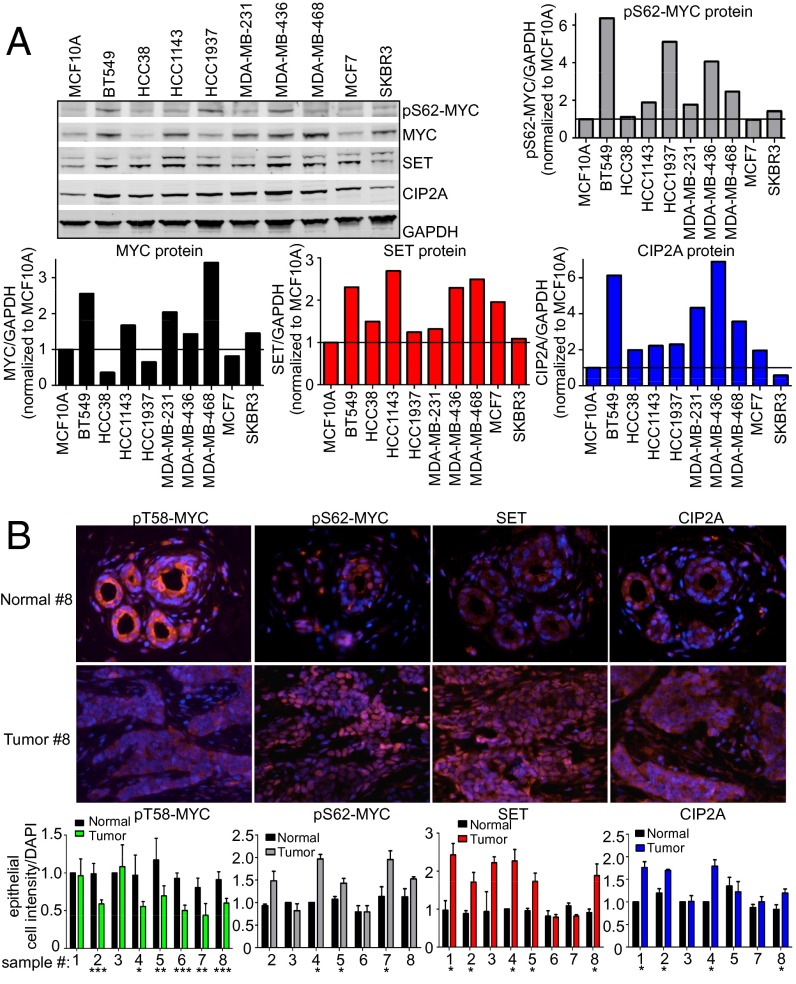
Fig. 2.
Increased SET, CIP2A, and pS62-MYC protein levels occur in human breast cancer. (A) Representative Western blots of SET, CIP2A, pS62-MYC, and MYC protein expression in 10 breast cell lines grown in 0.1% serum. Quantification of SET, CIP2A, pS62-MYC, and MYC protein expression over GAPDH was done using a LICOR scanner and software. Quantification is graphed relative to expression in MCF10A. (B) Immunofluorescence of serial formalin-fixed, paraffin-embedded sections of breast tumors stained for pT58-MYC, pS62-MYC, SET, and CIP2A compared with their adjacent normal breast tissue. The graphs represent quantification of the mean staining intensity per epithelial cell for each protein over DAPI across multiple regions of interest and then normalized to the adjacent normal. Error bars represent SD. *P < 0.05, **P < 0.01, and ***P < 0.001.

