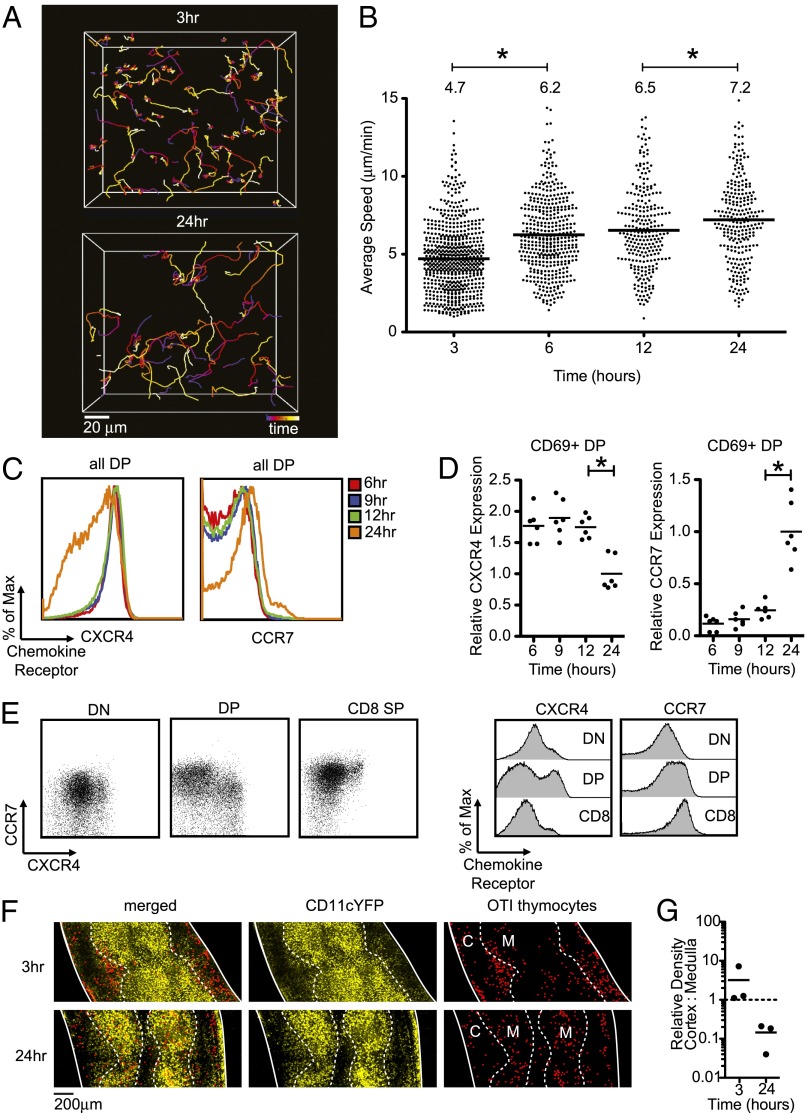
Fig. 2.
Migration and chemokine-receptor expression changes during the first 24 h of positive selection. For A and B, labeled thymocytes were allowed to migrate into selecting thymic slices and imaged by two-photon microscopy at the indicated times after thymocyte addition. (A) Tracks are color coded to indicate the passage of time over a 20-min period (blue-red-orange-yellow-white). Representative cell tracks at 3 h (Upper) versus 24 h (Lower). Image is a maximum projection along the z axis of an imaging volume of dimensions (170 × 142 × 80 μm). (B) Average track speeds of OT1 TCR transgenic thymocytes after culture for the indicated times in positive-selecting slices. Each dot represents an individual tracked cell. Data are compiled from seven runs (269 tracks) for 3 h, four runs (431 tracks) for 6 h, four runs (262 tracks) for 12 h, and six runs (257 tracks) for 24 h. Bar and number above the plots indicate the overall average of the average speed of each individual track for each condition. *P < 0.05. (C–E) Flow-cytometric analysis of chemokine-receptor levels. For C and D, preselection OT1 thymocytes were introduced onto selecting slices, and samples were dissociated and analyzed by flow cytometry at the time point indicated. (C) Representative CXCR4 (Left) and CCR7 (Right) expression on gated DP OT1 TCR transgenic thymocytes after culture for the indicated times in positive-selecting slices. (D) Mean fluorescence intensity (MFI) of CXCR4 (Left) and CCR7 (Right) gated CD69+ DP OT1 TCR transgenic cells from a positively selecting slice. Data are combined from two experiments and are normalized to the average value at the 24 h time point for each experiment. *P < 0.05. (E) Expression of CXCR4 and CCR7 on gated CD4−CD8−:DN, CD4+CD8+:DP, or CD8+CD4−:CD8 SP thymocytes from OT1 TCR transgenic mice on a positive-selecting background. Corresponding histograms are shown to the Right. (F) Localization of preselection OT1 TCR transgenic thymocytes (red spots applied in Imaris for improved visualization indicate individual OT1 TCR transgenic cells) after 3 h or 24 h on CD11cYFP selecting slices. The relative density of YFP signal was used to identify the cortical–medullary junction (dashed line). Solid lines indicate the outlines of the tissue, and medullary (M) and cortical (C) regions are indicated. (G) Quantification of OT1 TCR transgenic thymocyte localization in cortex and medulla normalized to volume; each dot represents one image. Bar indicates average.

