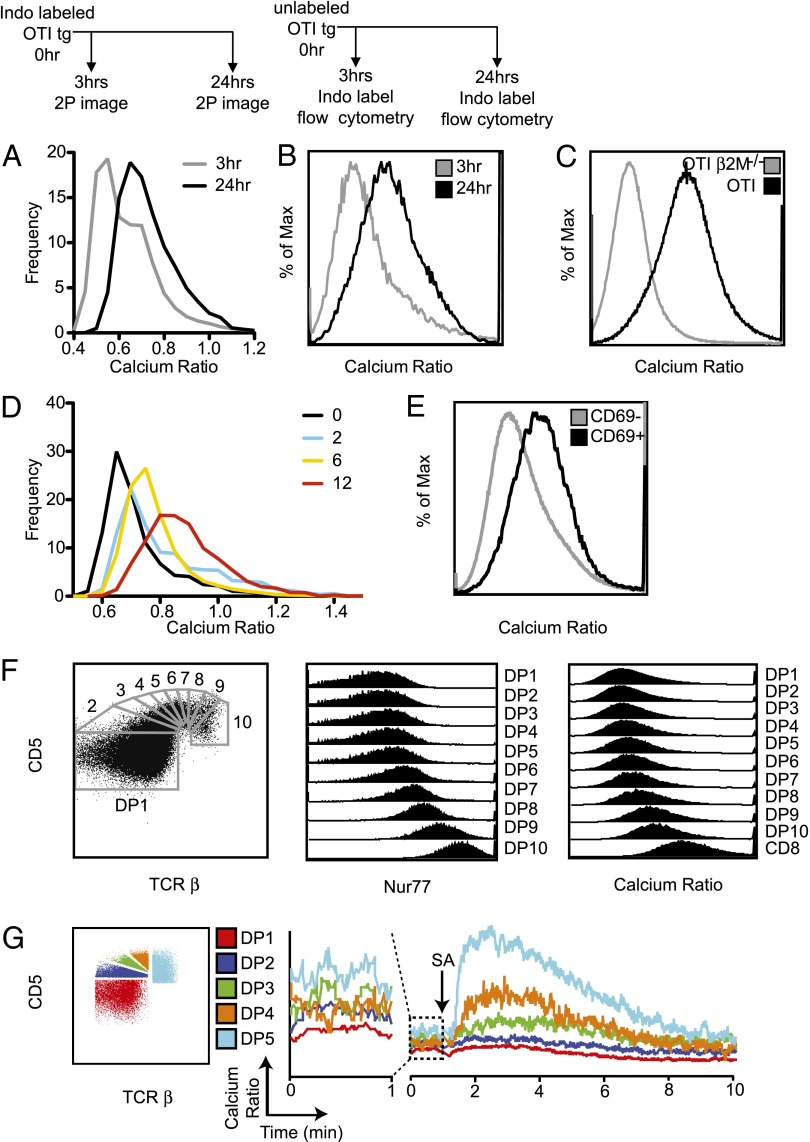
Fig. 3.
Gradual increase in basal [Ca2+]i with increasing time of positive selection. (A) Preselection OT1 TCR transgenic thymocytes were labeled with Indo1LR, introduced into positive-selecting thymic slices, and analyzed by two-photon microscopy at 3 h and 24 h. Data are from three movies at each time point, from three experiments. (B) Flow-cytometric analysis of basal calcium after 3 h and 24 h of positive selection. Unlabeled preselection OT1 TCR transgenic cells were introduced into selecting thymic slices, isolated after 3 h or 24 h of culture, and then labeled with Indo1LR and analyzed by flow cytometry. Experimental schematic is indicated above figures. Shown is the distribution of calcium ratios at 3 h (gray) and 24 h (black). Data is representative of two experiments. (C) Calcium levels for the DP population of OT1 Rag−/− β2M−/− (preselection) and OT1 Rag−/− (steady-state TCR transgenic) thymocytes. Data is representative of two experiments. (D) Preselection Zap-70(AS) OT1 preselection thymocytes were loaded with the ratiometric calcium indicator dye, Indo1LR, and introduced onto selecting thymic slices in the presence of 2.5 μM of the Zap-70(AS) inhibitor, 3-MB-PP1. After 2 h, the inhibitor was washed out, and samples were imaged by two-photon microscopy at 0 h, 2 h, 6 h, and 12 h. Frequency histograms of calcium ratios at the indicated time points after wash-out of inhibitor. Data are from two movies at each time point from two experiments. For E and F, WT thymocytes were loaded with Indo1LR and analyzed by flow cytometry. Data is representative of two experiments. (E) Basal calcium levels for gated CD69− and CD69+ DP thymocytes from a WT thymus. (F) WT DP thymocytes were subdivided based on levels of CD5 and TCRβ (Left), and Nur77 (Center), or calcium ratio (Right) of each gated DP population is displayed. (G) WT thymocytes were loaded with Indo1LR and stained for flow cytometric analysis and calcium flux. The gating for DP subsets is shown (Left). For the calcium flux, a 1-min baseline was established (Center, enlarged plot), and then thymocytes were stimulated by cross-linking anti-CD3ε-biotin with streptavidin (arrow). The kinetics of the change in calcium ratio is shown (Right). Data is representative of three experiments.

