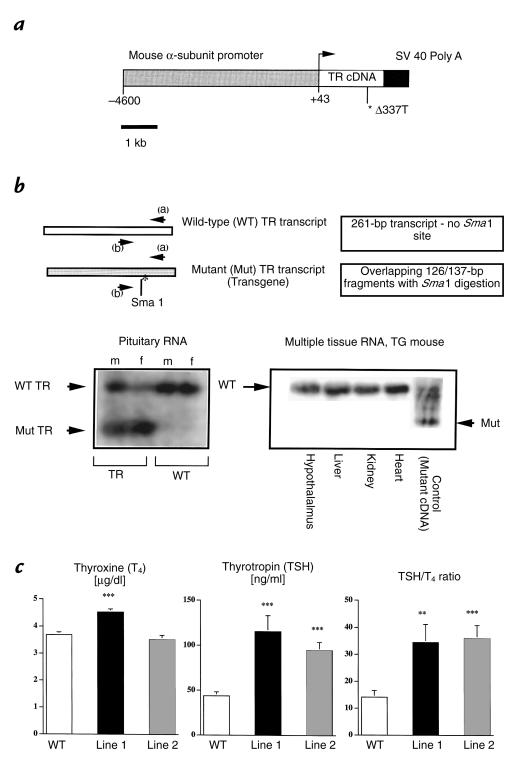
Figure 1.
Transgenic construct, pituitary expression of the transgene, and impact on basal thyroid hormone concentrations. (a) Schematic representation of the transgene. The vector contains 4.6 kb of the mouse glycoprotein subunit α gene cloned upstream of the human TR-β1 cDNA harboring the mutation Δ337T and ligated to a 400-bp fragment containing the SV40 polyadenylation signal. (b) RT-PCR scheme for detecting transgene expression and expression of the mutant and wild-type TR transcripts in mouse pituitaries and other tissues. RNA was obtained from pituitary, hypothalamus, liver, kidney, and heart, and analyzed by RT-PCR using primers (denoted a and b) that are homologous both to the human and mouse TR sequences. These primers amplify 261 bp of the carboxyl-terminus of the human and mouse TR-β gene. A polymorphism in the human gene results in the presence of a Sma1 restriction site that is not present in the mouse gene. Restriction digestion with this enzyme results in the appearance of 126/137-bp overlapping fragments indicating transgene expression. Gels shown were performed after Sma1 digestion of the RT-PCR products. Note that the smaller transcript appears only in the pituitaries of TG mice but is absent from WT mouse pituitaries and from multiple other tissues, including the hypothalamus in TG mice. Data is shown for line 1 mice; similar results were obtained for line 2 mice, which had 50% lower pituitary transgene expression vs. line 1. (c) Basal total T4, TSH concentrations, and TSH/T4 ratios (means ± SEM) in the WT and TG mice from two independent transgenic founder lines (1 and 2). The number of animals used for T4 determinations are WT: n = 89; line 1: n = 84; and line 2: n = 39, respectively. The number of animals used for TSH determinations are WT: n = 51; line 1: n = 40; and line 2: n = 46. The number of samples on which T4 and TSH were simultaneously measured for the purpose of calculating the TSH/T4 ratio are WT: n = 24; line 1: n = 26; and line 2: n = 26. Note the small increase in T4 concentration in line 1 and the lack of T4 elevation in line 2, despite large increases in TSH concentration. **P < 0.01 vs. WT; ***P < 0.0001 vs. WT. RT, reverse transcription; T4, thyroxine; TG, transgenic; TSH, thyroid-stimulating hormone; WT, wild-type.

