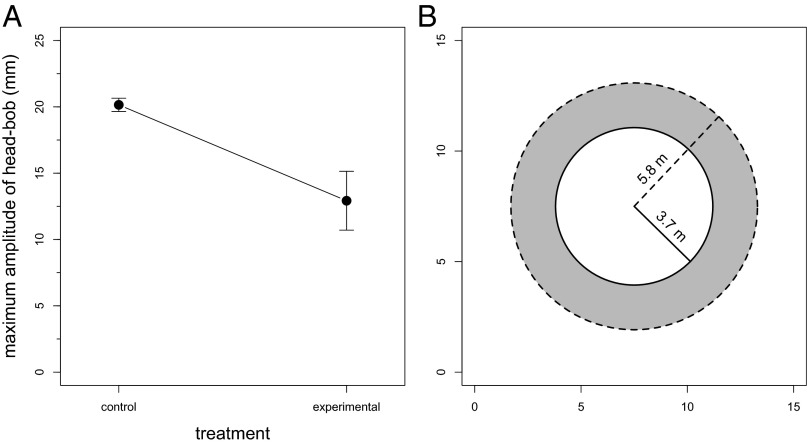
Fig. 3.
Change in the physical properties of head bob displays given by male A. sagrei in response to the presence of L. carinatus and its effects on the signaling active space. (A) Maximum amplitude of head-bob displays given in both control (nonpredator) and experimental (predator) treatments. Values are the mean and one SEM for each treatment; n = 9. (B) Illustration of the differences in conspecific active signaling space of A. sagrei on predator and nonpredator islands. The active space of a typical head-bob display from a lizard on a predator island (solid line; 3.7 m) is smaller than the active space of a typical display from a lizard on a nonpredator island (dashed line; 5.8 m). Circles demarcate the area within which an anoline receiver would be maximally stimulated by a typical signal given by a lizard on a predator island (solid circle) and a typical signal given by a lizard on a nonpredator island (dashed circle), assuming that the signaling lizard is located at the center of the circle. The x- and y-axes are used simply to scale the two circles in meters.

