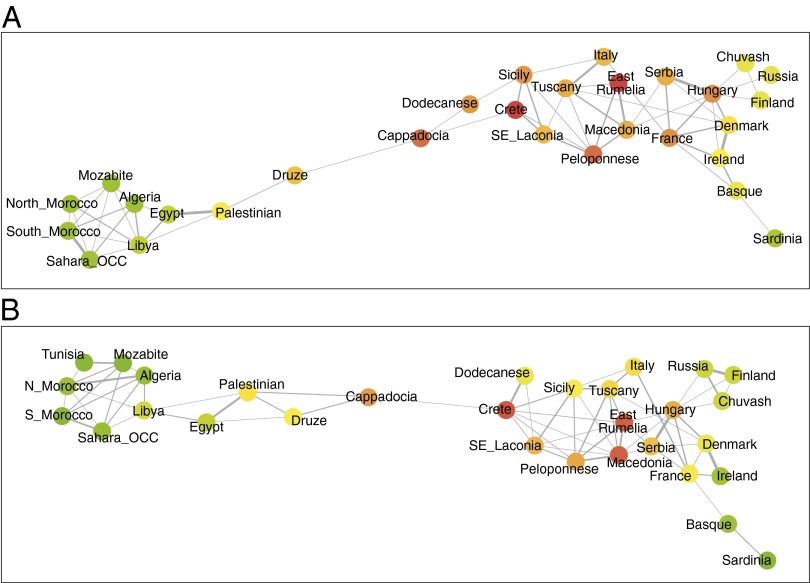
Fig. 4.
A coastal route of colonization of Europe. (A) A network analysis and visualization of the connections among 30 populations as revealed by the top five principal components. The network was formed by identifying nearest neighbors of each individual outside its populations of origin. Thicker edges represent stronger genetic relationships between pairs of populations, whereas warmer colors indicate high centrality of the respective nodes. The route connecting North Africa, Middle East, and Anatolia via the islands of the Dodecanese, and Crete to the rest of Europe, is apparent. (B) A network analysis and visualization of connections among 30 populations as revealed by ADMIXTURE with K = 5. Results are very similar to those in Fig. 4A, despite the fact that Admixture is a very different technique to extract ancestry information. Our networks are robust to the use of additional principal components or larger values of the ADMIXTURE parameter K for their formation (SI Appendix, Figs. S7 and S8).

