Fig. 1.
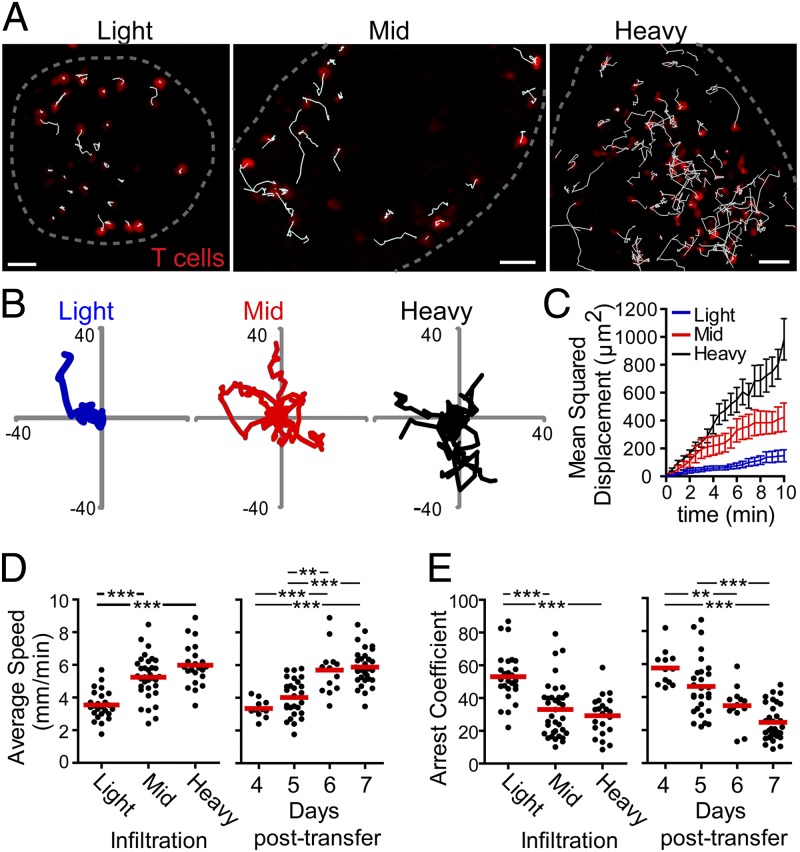
T cells arrest during early infiltration and regain motility with increased infiltration. CD2-dsRed.OT-I CD8+ T cells or 10% CD2-dsRed.OT-I CD8+ T cells plus 90% OT-I CD8+ T cells were transferred into RIP-mOva or RIP-mOva.CD11c-YFP recipient mice. Islets were isolated 4–7 d following T-cell transfer, immobilized in low-melting agarose, and imaged by time-lapse two-photon microscopy. (A) Representative maximum intensity projection images of T-cell (red) motility in islets with light, mid, and heavy T-cell infiltration. All infiltrating OT-I T cells are visualized in the islet with light infiltration whereas only 10% of infiltrating OT-I T cells are visualized in the islets with mid and heavy infiltration. White tracks show the path of T-cell motility over 10 min. The dashed gray line indicates the islet border. (Scale bars: 30 μm.) (B) Ten randomly selected T-cell tracks from the islets shown in A. Scale shown in μm. (C) Mean squared displacement of T cells over 10 min time. Analysis includes all cells tracked in A. Error bars = SEM. (D and E) Quantification of T-cell motility. Each dot represents the average of all tracked T cells in one islet, and the red bar represents the mean of all islets. Data were combined from 82 islets in 13 experiments. Statistical analyses were done using a 1-way ANOVA Kruskal–Wallis test with Dunn’s Multiple Comparison Test. *P < 0.05, **P < 0.001, ***P < 0.0001. (D) Average speed of T-cell crawling in infiltrated islets. (E) Arrest coefficient of T cells in infiltrated islets.

