Fig. 2.
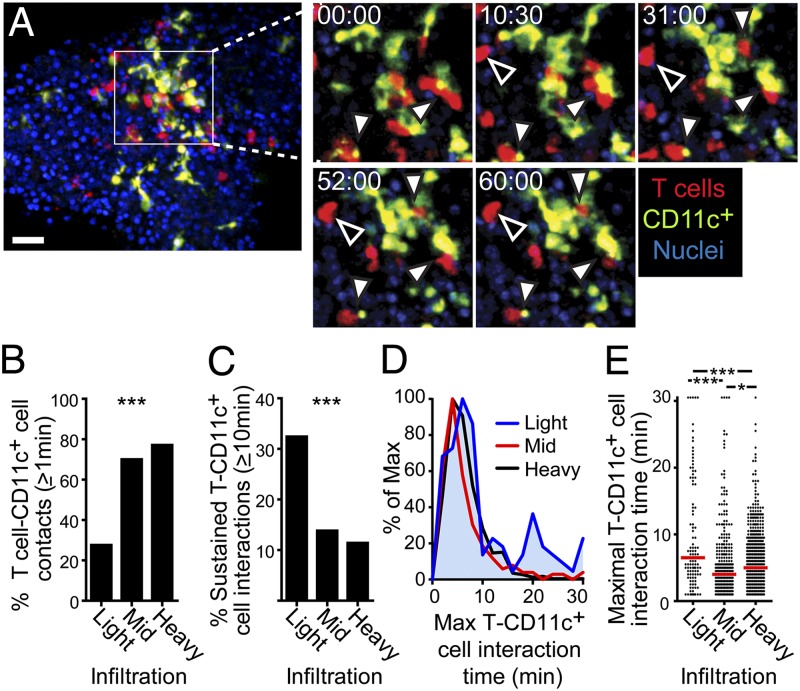
T cell–APC interactions convert from sustain to transient with increased infiltration. Isolated islets were imaged by time-lapse two-photon microscopy as described for Fig. 1. *P < 0.05, **P < 0.001, ***P < 0.0001. (A) Representative time-lapse imaging of sustained T-cell interactions in a lightly infiltrated islet. Filled arrowheads indicate sustained interactions of a T cell with a CD11c+ cell, and open arrowheads indicate sustained interactions of a T cell with an unlabeled cell. (Scale bar: 30 μm.) Time-lapse area shown represents 90 μm (x) × 90 μm (y) × 15 μm (z). Time stamp, min:sec. (B–E) Quantification of T cell–CD11c+ cell interactions. Data were combined from nine experiments. (B) Percentage of T cells that contacted a CD11c+ cells for at least 1 min. (C) Percentage of T cells that maintain T cell–CD11c+ cell interactions for at least 10 min. (B and C) Statistical analyses were done using a Chi Square Test. (D and E) Duration of the longest T cell–CD11c+ cell interaction per interacting T cell. (E) Each dot represents one T cell, and the red bar represents the median. Statistical analyses were done using a 1-way ANOVA Kruskal–Wallis test with Dunn’s Multiple Comparison Test.

