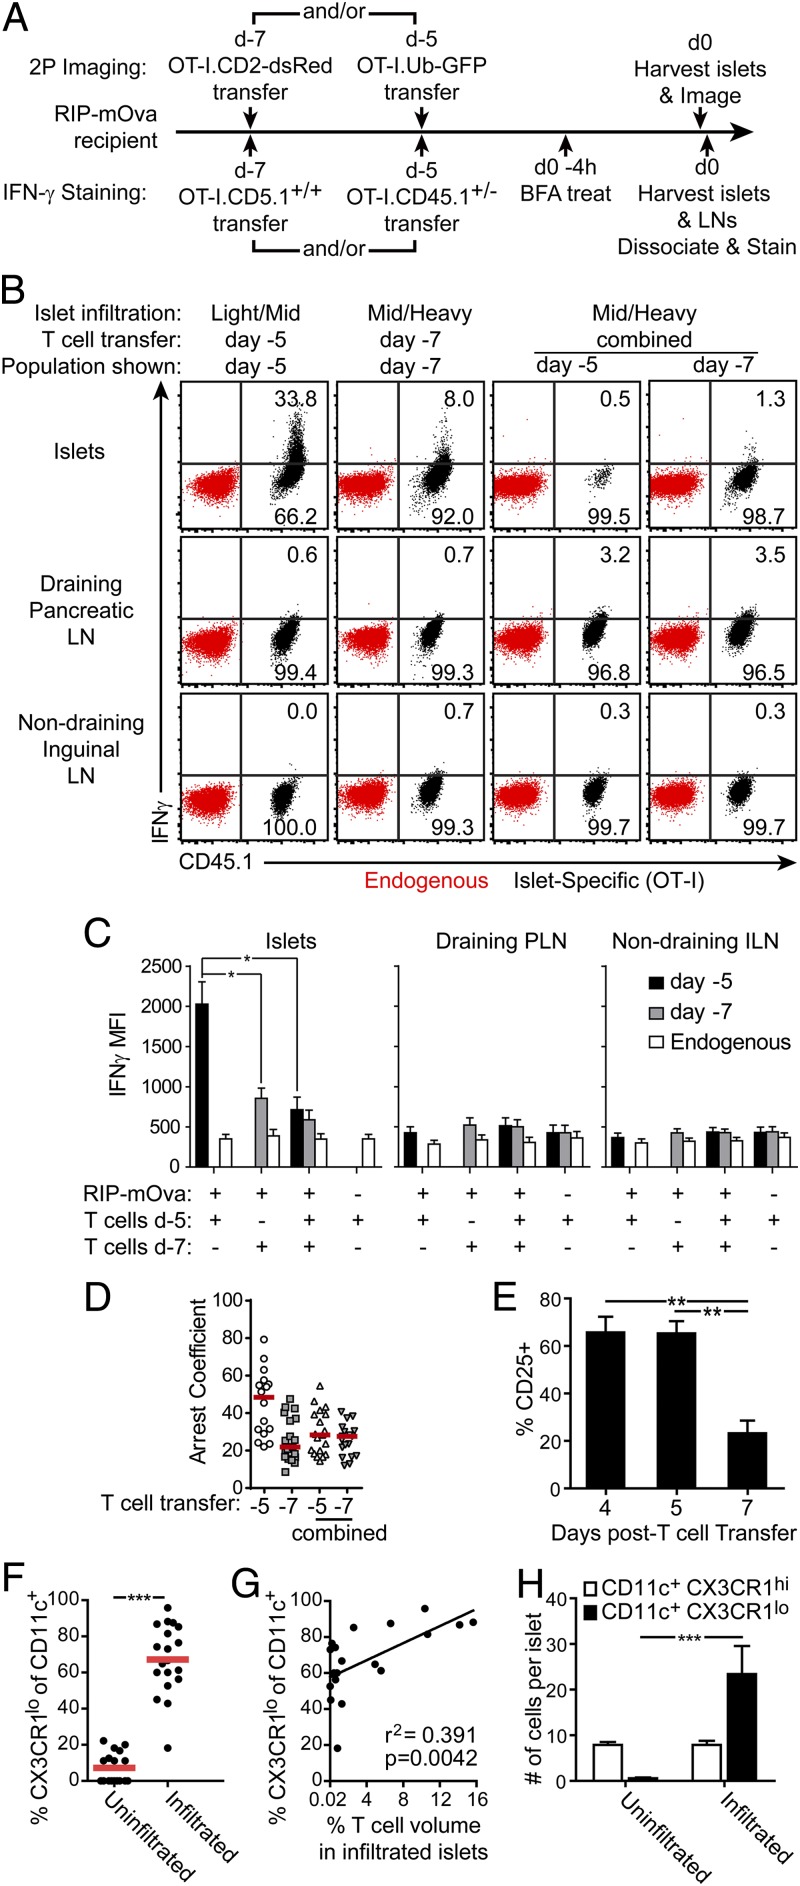
Fig. 5.
T-cell dynamics and effector cytokine production are determined by the state of islet infiltration. (A) Experimental set-up for (B–D). (B) Induction of IFN-γ production in the islets is associated with T-cell arrest. Representative plots of in vivo IFN-γ production by intracellular cytokine staining. (C) Quantification of data shown in B. Data combined from six mice in three experiments. Statistics: 1-way ANOVA Kruskal–Wallis test with Dunn’s Multiple Comparison Test. *P < 0.05. (D) Environmental factors prevent T-cell arrest in heavily infiltrated islets. Quantification of T-cell arrest coefficients analyzed by time-lapse two-photon imaging of T cells in early (d5) or late (d7) infiltrated islets. (E) CD25 expression is lost as T cells become more motile. Four animals per group combined from two experiments. **P < 0.01 by 1-way ANOVA Kruskal–Wallis test with Dunn’s Multiple Comparison Test. (F–H) CD11c+CX3CR1low APCs are recruited to the islets with infiltration. APC populations analyzed on a per-islet basis by two-photon microscopy at varying degrees of infiltration in RIP-mOva.CX3CR1-GFP.CD11c-YFP mice. Each dot represents one islet. (F) Uninfiltrated islets were analyzed in mice without T-cell transfer. **P < 0.01 by two-tailed t test. (G) Analysis of CX3CR1low APCs in infiltrated islets. CX3CR1low APCs correlate with T-cell infiltration. (H) Average cell count per islet of CX3CR1low versus CX3CR1high CD11c+ APCs with and without islet infiltration. ***P < 0.0001 by 2-way ANOVA with Tukey’s multiple comparison test.

