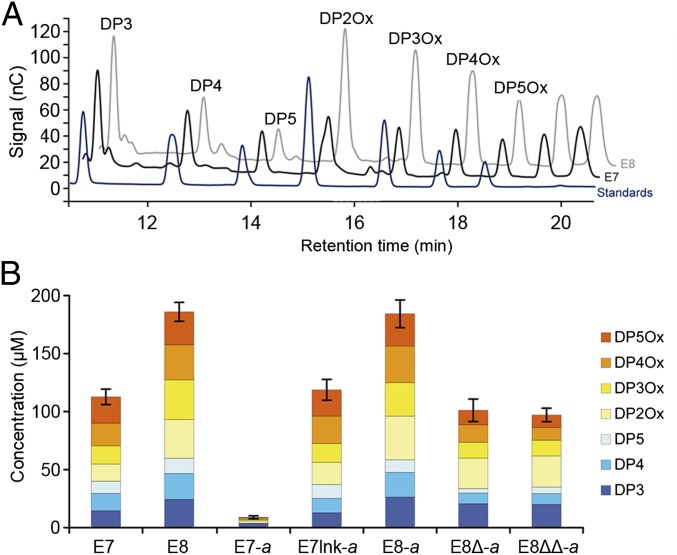
Fig. 2.
Oxidative cleavage of cellulose by E7, E8, and their dockerin variants. (A) HPAEC analysis of the soluble sugars released by the action of E7 (black) and E8 (gray) on Avicel, compared with reduced and oxidized standards (dark blue). Peak annotation was performed according to the standards’ retention times (DP2Ox, cellobionic acid; DP3, cellotriose; DP3Ox, cellotrionic acid; DP4, cellotetraose; DP4Ox, cellotetraonic acid; DP5, cellopentaose; DP5Ox, cellopentaonic acid). Two unlabeled peaks were visible at retention times greater than 19 min for which no standards were available (presumably cellohexaonic and celloheptaonic acids). (B) Quantification by HPAEC analysis of the soluble sugar released from the cleavage of microcrystalline cellulose (Avicel, 10 mg/mL) by 1 µM LPMO, at 50 °C for 72 h. The concentration (in micromolars) of each sugar was determined by integration of the peak area and comparison with a standard curve. Unlabeled peaks were not quantified. Values are the mean of three biological replicates (n = 3). Error bars correspond to one cumulated SD (error bar = ±SDtot; with SDtot = √(SD12 + SD22 + …). For clarity, data are only shown for retention times between 10.5 and 20.5 min. No peak was observed for longer retention times. Detailed concentrations and associated SDs are available in Fig. S1.

