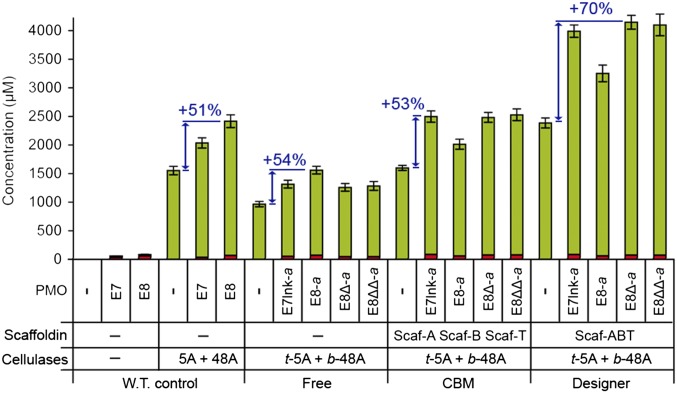
Fig. 5.
Degradation of cellulose by LPMO-containing designer cellulosomes. Quantification by HPAEC analysis of the soluble sugars released from the cleavage of microcrystalline cellulose (Avicel, 10 mg/mL), at 50 °C for 72 h. Different architectures were assayed: free enzymes (W.T. control and Free), enzymes bound to monovalent scaffoldins (CBM), and enzymes bound to trivalent scaffoldin (Designer). Each protein was added at a final concentration of 0.5 µM. Concentrations of reducing sugars (green) and oxidized sugars (red) are shown. Values for reducing sugars were obtained by adding the concentrations of DP1–DP5 (where DP1 = glucose, DP2 = cellobiose, DP3 = cellotriose, DP4 = cellotetraose, and DP5 = cellopentaose). Values for oxidized sugars were obtained by adding the concentrations of DP1Ox-DP5Ox. The detailed concentrations are available in SI Materials and Methods. Blue arrows and the associated values indicate the percent increase (“boost effect”) in reducing sugars, related to the addition of a LPMO, compared to that of the control. Detailed concentrations and associated SDs are available in Fig. S3A. Values for oxidized sugars were obtained by adding the concentrations of DP1Ox-DP5Ox. The detailed concentrations of oxidized sugars and the associated SDs are available in Fig. S3B.

