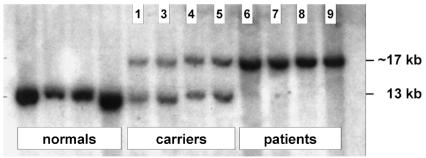
Figure 3.
Southern blot analysis of the FGA deletion. The deletion appears as a band of paradoxically increased size because two BamHI sites are eliminated (see schematic in Fig. 4). Lanes 1–4, normal controls; lanes 5–8, obligate carriers; lanes 9–12, patients. Family members in lanes 5–12 are numbered according to the family tree in Fig. 1.

