
Figure 2.
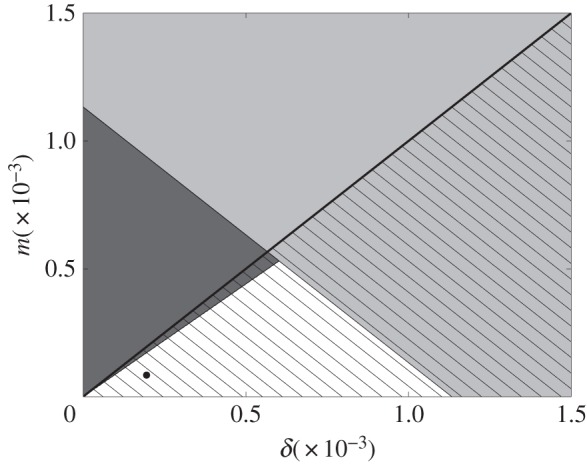
The δ−m parameter plane for the stability of model equilibria  ,
,  and
and  . (full vaccine coverage, disease-free) is stable in the hatched region below the thick black diagonal line. (no vaccine coverage, endemic) is stable in the light grey region. (partial vaccine coverage, endemic) is stable in the dark grey region on the left. Parameter values come from estimates in §3a. Estimated δ and m values are represented in the plane by the black dot. Other parameter values are σ = 1, κ = 1.69 yr−1, β = 280 yr−1, μ = 1/50 yr−1 and γ = 365/22 yr−1.