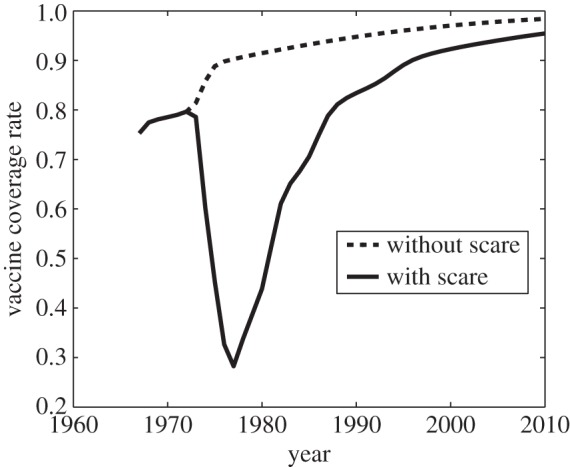
Figure 6.

Simulation of pertussis vaccine coverage in the UK in the period 1967–2010, at the estimated parameter values (σ = 26.1, δ = 1.95 × 10⁻⁴, m = 8.43 × 10⁻⁵, D = 5.89 years and κ = 1.69 yr−1) used to generate figure 1e,f, which correspond to the vaccine scare (solid line), and for the same parameter values, but with no scare having ever occurred, σ = 1 (dashed line). Other parameter values are β = 280 yr−1, μ = 1/50 yr−1 and γ = 365/22 yr−1.
