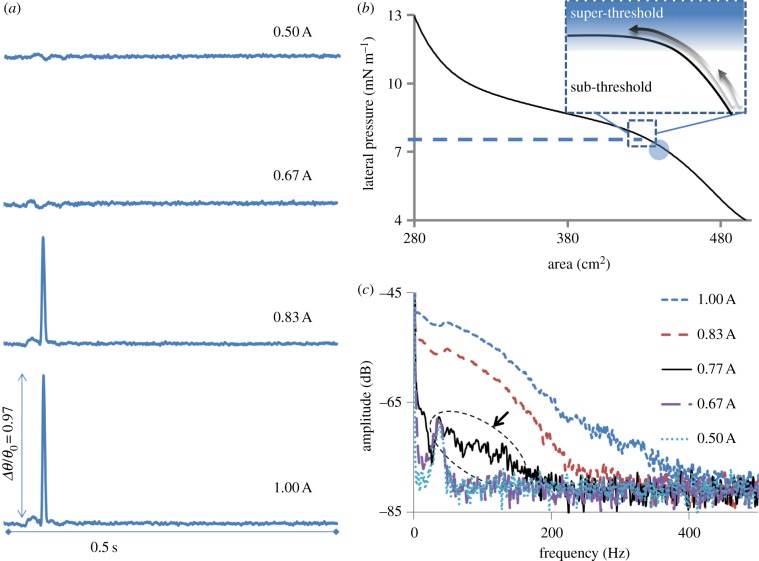
Figure 3.
Threshold for excitation of solitary waves. (a) The pulses resulting from varying the excitation strength are shown for a fixed state marked by the circle in (b). Clearly, a ‘threshold’ for the onset of solitary behaviour exists between excitation strength of 0.67 and 0.83 A in this state, where maximum displacement amplitude of approximately 1 mm corresponds to 1 A. The inset in (b) represents the idea of a threshold on a generalized state diagram where solitary pulses can be excited by super-threshold excitation. (c) The corresponding average frequency spectrums of the pulses are shown. The arrow points to the onset of nonlinear behaviour (see the electronic supplementary material, figure S4). All the pulses in (a) are plotted on same scale for the y-axis representing the variations in FRET parameter. Experiments were performed on a lipid (DPPC) monolayer at a lateral pressure of 7.2 mN m−1 and 21°C. (Online version in colour.)

