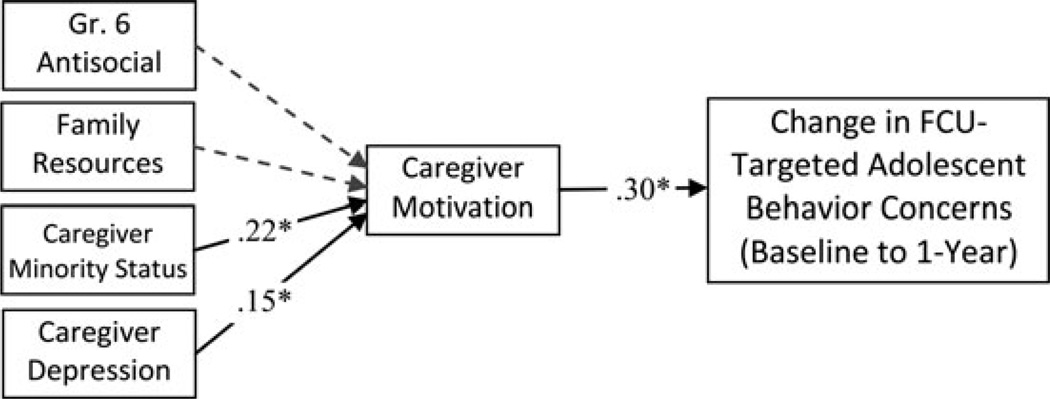
Figure 4.
The ecology of change in Family Check-Up (FCU) goals. The path coefficients reflect standardized betas. All estimated paths are represented. Paths represented by solid lines were statistically significant (p < .05), and dashed lines were nonsignificant. Model fit: χ2 (4) =2.340, p =.67; comparative fit index =1.00; Tucker–Lewis index =1.00; root mean square error of approximation =0.00 (90%: 0.00–0.09). Gr., Grade.

