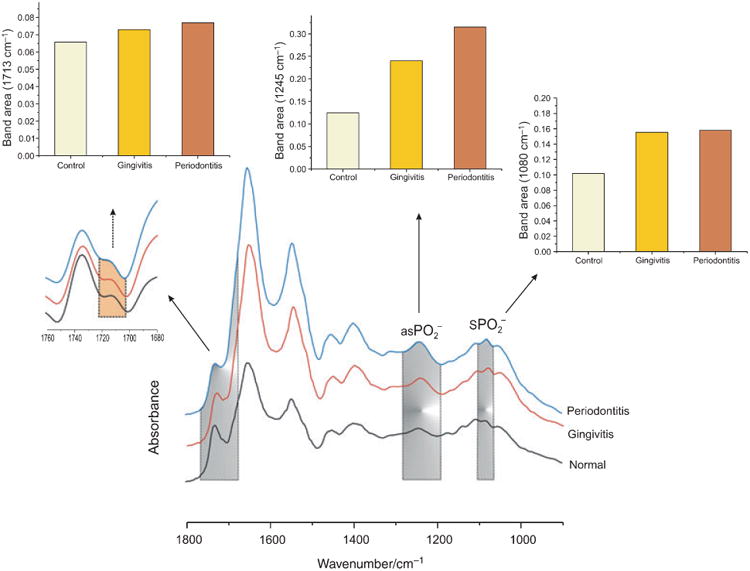
Fig. 2.

Relative DNA contributions are increased in diseased gingival crevicular fluid groups. The shaded areas highlight DNA-specific signals in gingival crevicular fluid. The inset traces are an enlarged area of another important DNA band, 1713 cm−1, arising from DNA pair base vibration after Fourier self-deconvolution. Also shown are histograms representing the integrated area (relative DNA content) in the mean spectra from the three groups. , symmetric ; as , asymmetric .
