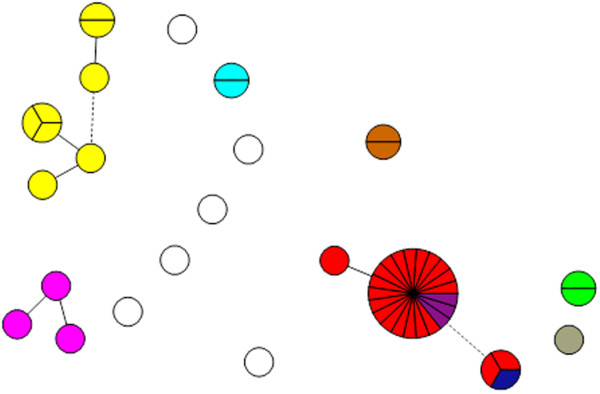
Figure 1.

Minimal Spanning Tree (MST) of V. cholerae isolates based on MLST data. Each circle corresponds to a sequence type. The number of partitions in each circle corresponds to the number of isolates. Single locus variants are connected with a solid line; two single variants are connected with a dotted line. Red, serogroup O1 serotype Ogawa strains (GT1); purple, serogroup O139 (GT1); dark blue, serogroup O1 serotype Hikojima (GT1); yellow, serogroup O1 serotype Inaba (GT2); pink, serogroup O1 serotype Ogawa (2x) and Inaba (1x) (GT3). Green, brown and light blue, non-O1 or O139 serogroup strains (GT4, GT5, GT6). Gray, V. mimicus.
