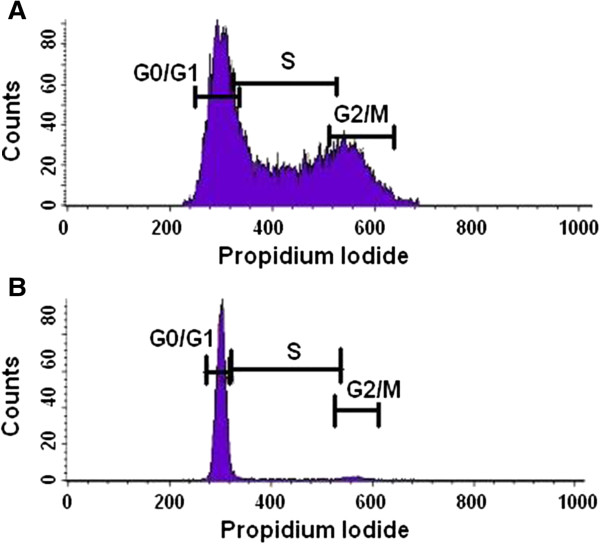
Figure 4.

Cell cycle profiles determined by FACS analysis. The graphs illustrate the cell count in the different phases of the cell cycle, which correlates to the propidium iodide intensity. A The cell cycle profile of PreB lymphocytes of BALB/c origin. 45.08% of cells are found in G0/G1, 44.18% in S and 21.80% in G2/M. B The cell cycle profile of primary B cells from [T38HxBALB/c] wild-type mice. 94.76% of cells are found in G0/G1, 5.22% in s and 2.38% in G2/M.
