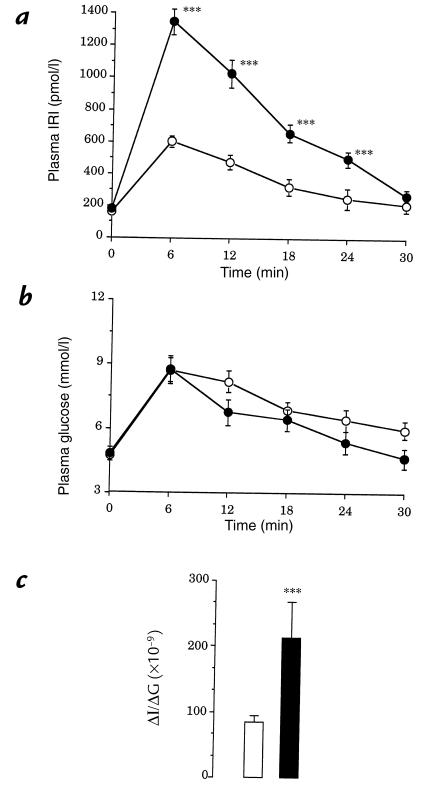
Figure 3.
Time course of plasma insulin (a) and glucose (b) concentrations in response to glucose loading in control (open circles) and IL (filled circles) rats. Values are means ± SEM of 10 cases for both groups. (c) Insulinogenic index (ΔI/ΔG) in control (open bar) and IL (filled bar) rats. ***P < 0.001, significantly different from control rats.

