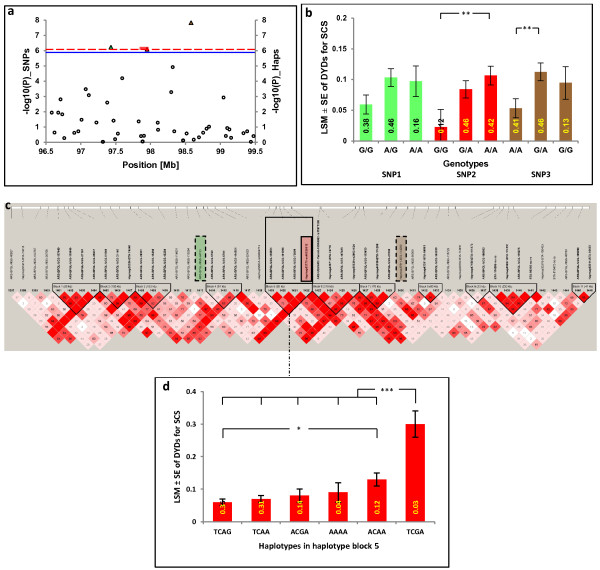
Figure 2.

Significant region on BTA5 associated with DYDs for SCS. (a) Manhattan plot for GWAS of significant SNPs and haplotypes; horizontal blue and red dashed lines indicate the whole-genome significance thresholds at P ≤ 0.05 after Bonferroni correction for single markers and haplotypes, respectively; triangles refer to significant SNPs and bars refer to significant haplotypes. (b) Genotype effect plot of the three significantly associated SNPs. (c) Linkage disequilibrium (LD) and haplotype block structure of the significant region on BTA5. Each box represents the LD, measured by D′, corresponding to each pair-wise SNP; haplotype blocks are indicated with black triangles, significant SNPs are highlighted in color and significant haplotypes are framed. (d) Haplotype effect plot of significantly associated haplotypes. *(P < 0.05), **(P < 0.01), and ***(P < 0.001) indicate significant differences among groups. Numbers inside the columns of (b) and (d) indicate genotype and haplotype frequencies; SNP1 = ARS-BFGL-NGS-44153; SNP2 = Hapmap53773-ss46526912; SNP3 = Hapmap47511-BTA-114200; see Additional files 1 and 2 for information on significant regions of other chromosomes.
