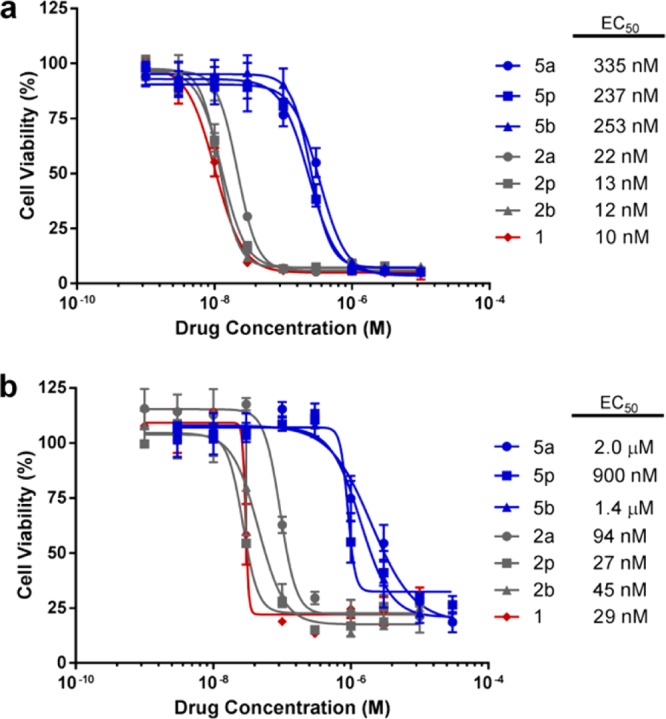
Figure 2.

Study of the prodrugs’ bioorthogonality. Semilog dose–response curves and calculated EC50 values of prodrugs 2a,p,b (in gray) and 5a,p,b (in blue) in comparison to those of unmodified gemcitabine (1, in red) in (a) BxPC-3 and (b) Mia PaCa-2 cells. Cell viability was measured at day 4 using PrestoBlue reagent. Error bars: ± SD from n = 3.
