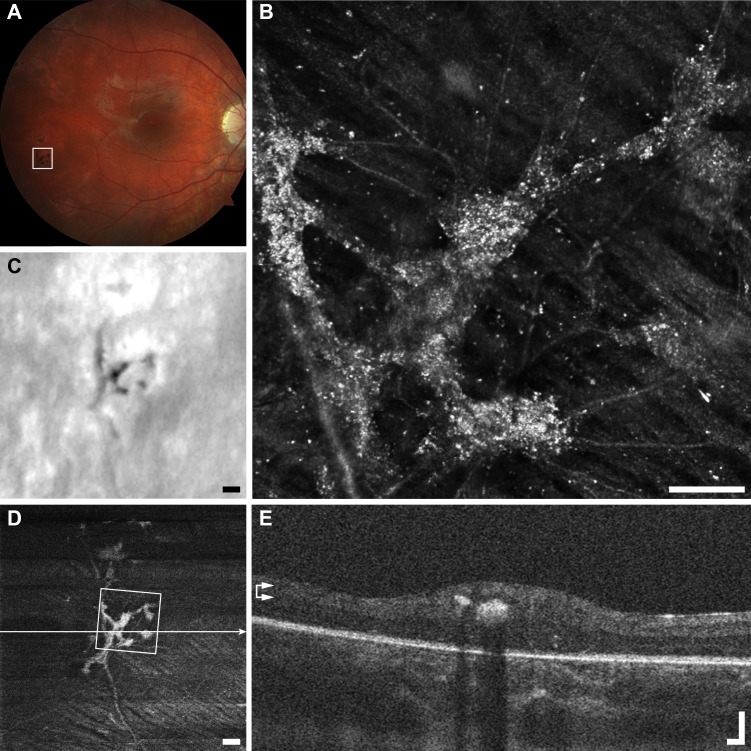
Figure 3.
Multimodal imaging of punctate retinopathy example (A1), rubella retinopathy JC_0830. (A) Fundus photo with outline of AOSLO imaging. (B) The AOSLO image showing many small punctate reflective structures approximately 5 μm across. These structures appear to coalesce at the vessel creating what appears to be a membrane in (C, D). Scale bar: 100 μm. Of interest here are the small structures themselves, as they are found in a variety of other diseases and normal (Figs. 1A2–A4). (C) Fundus image from scanning laser ophthalmoscope (SLO) of the Cirrus OCT. Scale bar: 200 μm. (D) En face OCT segmented at the level of the vasculature (horizontal arrows). Square shows AOSLO imaging region of interest, horizontal line indicates location of OCT B-scan in (E). Scale bar: 200 μm. (E) OCT B-scan showing hyper-reflectivity surrounding a retinal vessel. Scale bar: 100 μm.

