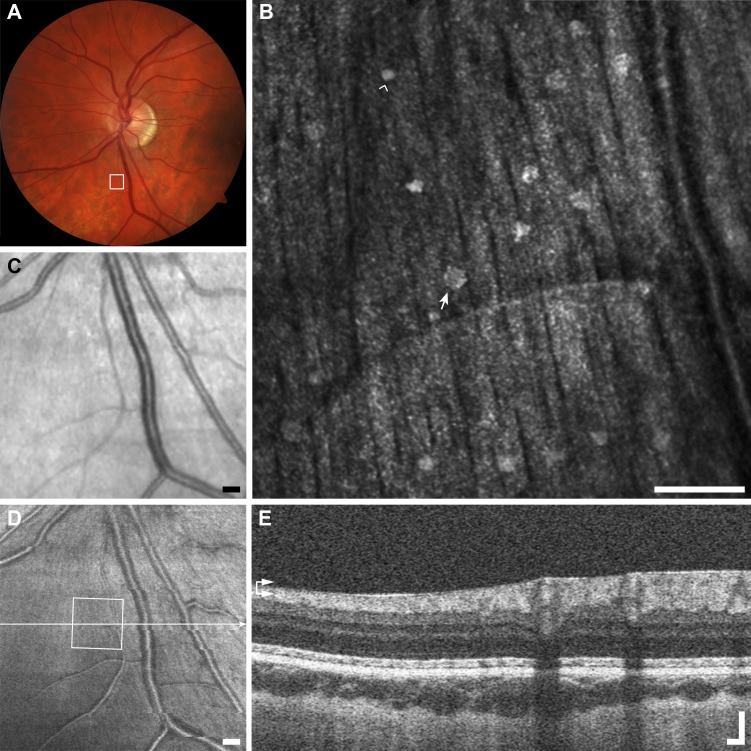
Figure 5.
Multimodal imaging of nummular reflectivity example (B1), normal subject JC_0007. (A) Fundus photo with outline of AOSLO imaging. (B) The AOSLO image showing many reflective structures 10 to 30 μm across glistening on the surface of the NFL. Scale bar: 100 μm. In this image the largest dot is approximately 24 μm in diameter (arrow), and the smallest is only 13 μm (arrowhead). (C) The LSO fundus image does not resolve the dots. Scale bar: 200 μm. (D) En face OCT segmented at the level of the ILM (horizontal arrows) also cannot resolve dots. Scale bar: 200 μm. (E) The OCT B-scan does not clearly resolve the small dots. Scale bar: 100 μm.

