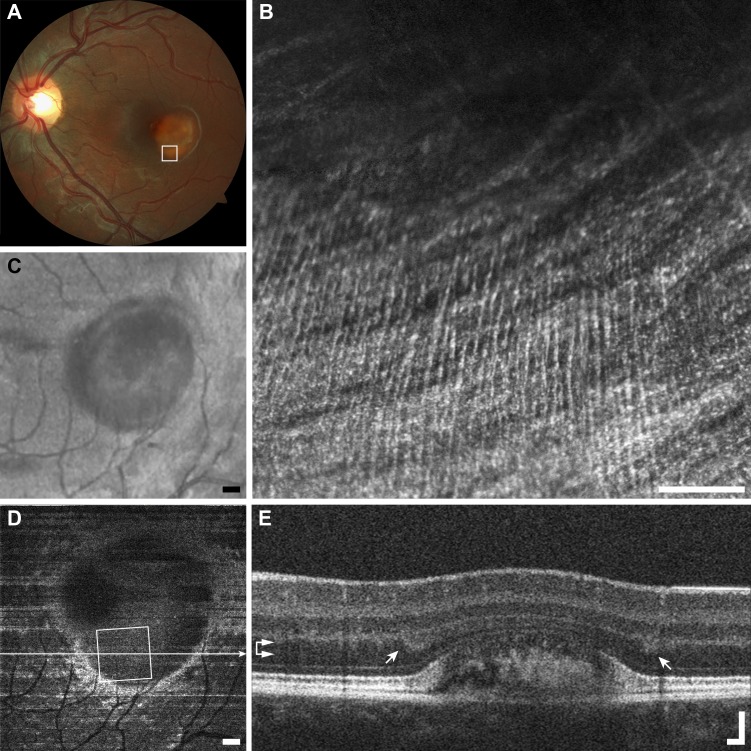
Figure 15.
Multimodal imaging of striate reflectivity example (G1), Best's disease KS_0601. (A) Fundus photo shows the large vitelliform lesion just temporal to the macula. (B) The AOSLO image shows the NFL coursing horizontally, while a striped reflective structure runs from vertically. Scale bar: 100 μm. (C) The SLO fundus image also resolves the vitelliform lesion, but not the vertically oriented fibers. Scale bar: 200 μm. (D) En face OCT segmented along the contour of the Henle fiber layer (horizontal arrows) shows a rim of bright Henle fiber reflectivity surrounding the vitelliform lesion. Scale bar: 200 μm. (E) The OCT B-scan shows regions of increased Henle fiber reflection on either side of the vitelliform lesion (arrows). Scale bar: 100 μm.

