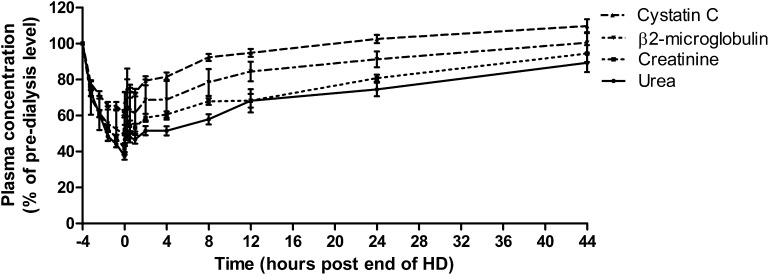
Figure 2.
Removal and rebound kinetics of small and middle molecules compared with cystatin C showing mean±SD level calculated as the percentage of predialysis concentration. All dialysis session lengths have been normalized to a 4-hour duration for the purpose of graphical representation. Data for the intradialytic and immediate postdialytic period are shown in more detail in Figure 3.

