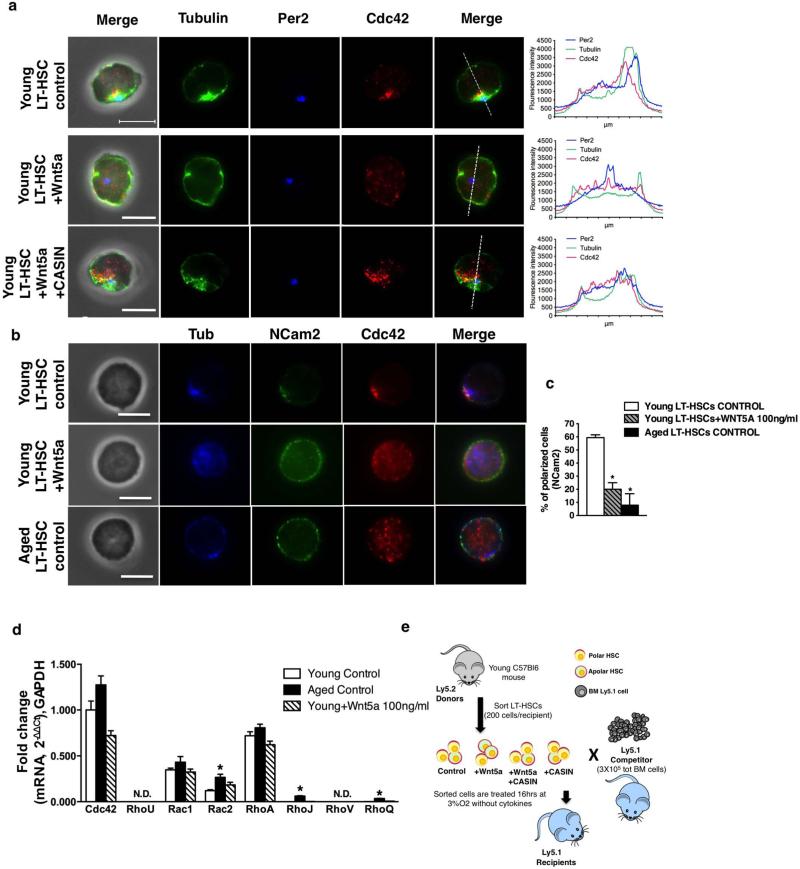
Extended Data Figure 2. Wnt5a activates Cdc42 inducing ageing-like phenotypes in young LT-HSCs.
a, Representative distribution of Cdc42, tubulin and Per2 (staining the centrosome) in young control, young Wnt5a-treated (100 ng ml−1) and young Wnt5a (100 ng ml−1) 1 casin (5 μM)-treated LT-HSCs determined by immunofluorescence. Scale bar, 5 μm. Shown are also representative fluorescence intensity plots obtained by collecting pixel intensity through the section of the cell as indicated by the dotted line in the corresponding merge picture. b, Representative distribution of Cdc42, tubulin and NCam2 (membrane protein) in young control, young Wnt5a-treated (100 ng ml−1) and aged LT-HSCs determined by immunofluorescence. Scale bar, 5 μm. c, Graph of the percentage of young control, young Wnt5a-treated (100 ng ml−1) and aged LT-HSCs with a polar distribution of NCam2. Shown are mean + 1 s.e., n = 4; ~200–300 LT-HSCs scored per sample in total. *P < 0.001. d, Reverse transcriptase real-time PCR analysis of Cdc42, Rhou, Rac1, Rac2, Rhoa, Rhoj, Rhov and Rhoq transcript levels in young, aged and young Wnt5a-treated (100 ng ml−1, 16 h treatment) LT-HSCs. Rhou and Rhov transcripts were below detection limits in all the assayed samples (ND). Data are expressed as fold difference compared to the expression of Cdc42 mRNA in young LT-HSCs arbitrarily set to 1. Data were analysed with the 2−ΔΔCt method and plotted on a linear scale. Bars are mean + 1 s.e.; n = 3, *P < 0.05. e, Schematic representation of the experimental set-up for the transplantation. Recipient mice were analysed 24 weeks after transplant.

